Observability Deployment Strategy
WSO2 Enterprise Integrator 7.1 offers two observability solutions for monitoring and managing your integration deployments in the Micro Integrator. You can choose one of the two solutions depending on the nature of your Micro Integrator deployment.
Choosing an observability strategy
The cloud-native solution is more suitable in the following scenarios:
-
You are creating a new cloud-native Micro Integrator deployment.
Note
See the instructions on setting up a cloud-native Micro Integrator deployment on Kubernetes.
-
You already have Prometheus, Grafana, and Jaeger as your in-house monitoring and observability tools. This applies to VM deployments as well as Kuberentes deployments.
The classic observability solution is more suitable in the following scenarios:
- You require more business analytics and less operational observability.
- You require a simpler deployment.
- You already have an observability stack such as ELK.
Cloud-Native Observability
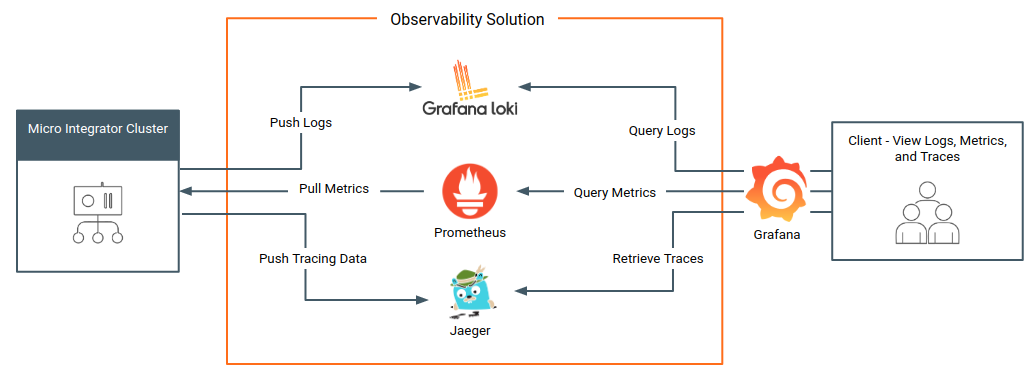
The following diagram depicts the complete cloud-native observability solution for your Micro Integrator deployment, which includes metrics monitoring, log monitoring, and message tracing capabilities.

You can also set up different flavours of this solution depending on your requirement.
Technologies
The cloud-native observability solution is based on proven projects from the Cloud Native Computing Foundation, which makes the solution cloud native and future proof. Following are the technologies used in the current solution:
| Feature | Technology |
|---|---|
| Metrics | Prometheus |
| Visualization | Grafana |
| Logging | Log4j2, Fluent-Bit, and Grafana Loki |
| Tracing | Jaeger |
Minimum cloud-native observability
The basic deployment offers you metrics capabilities. You can set up the basic deployment with only Prometheus and Grafana to view and explore with the available Prometheus metrics.

Log processing add on
Once you set up the basic deployment, you can integrate log-processing capabilities. To use this, you need to install Fluent-Bit as the logging agent and Grafana Loki as the log aggregator.

Message tracing add on
Once you set up the basic deployment, you can integrate message tracing capabilities. To use this you need to install Jaeger.

Classic Observability
In the solution, metrics monitoring and message tracing is handled using the EI Analytics. For log monitoring, use log4j2 logs. This is the same solution that was available for previous EI versions.
Technologies
| Feature | Technology |
|---|---|
| Metrics and Tracing | EI Analytics server |
| Visualization | EI Analytics Portal |
| Logs | Log4j2 |
Metrics and message tracing
The following diagram depicts how EI Analytics is used for metrics monitoring and message tracing.

Log processing
With the classical observability strategy, you cannot view logs from a dashboard (as you do with the cloud-native strategy). You need to first configure log4j2 logs for log monitoring. You can then use the Micro Integrator dashboard to download log files and manage them.
What's Next?
If you choose cloud-native observability, see the relevant topic for instructions:
If you choose classic observability, set up EI Analytics for statistics and message tracing.
Top