Testing The Pipeline Environment
It is a very simple process to test your pipeline environment. Follow the steps below:
-
Explore the Spinnaker Dashboard [ Each application in Spinnaker consists of two dashboards those are for pipelines and infrastructure. The pipeline dashboard can be utilized to view the executions of each pipelines of the application while the infrastructure dashboard can be used to view the deployed resources for the application]
Navigate to the Spinnaker dashboard at
https://spinnaker.example.comand select Applications > wso2mi > Pipelines.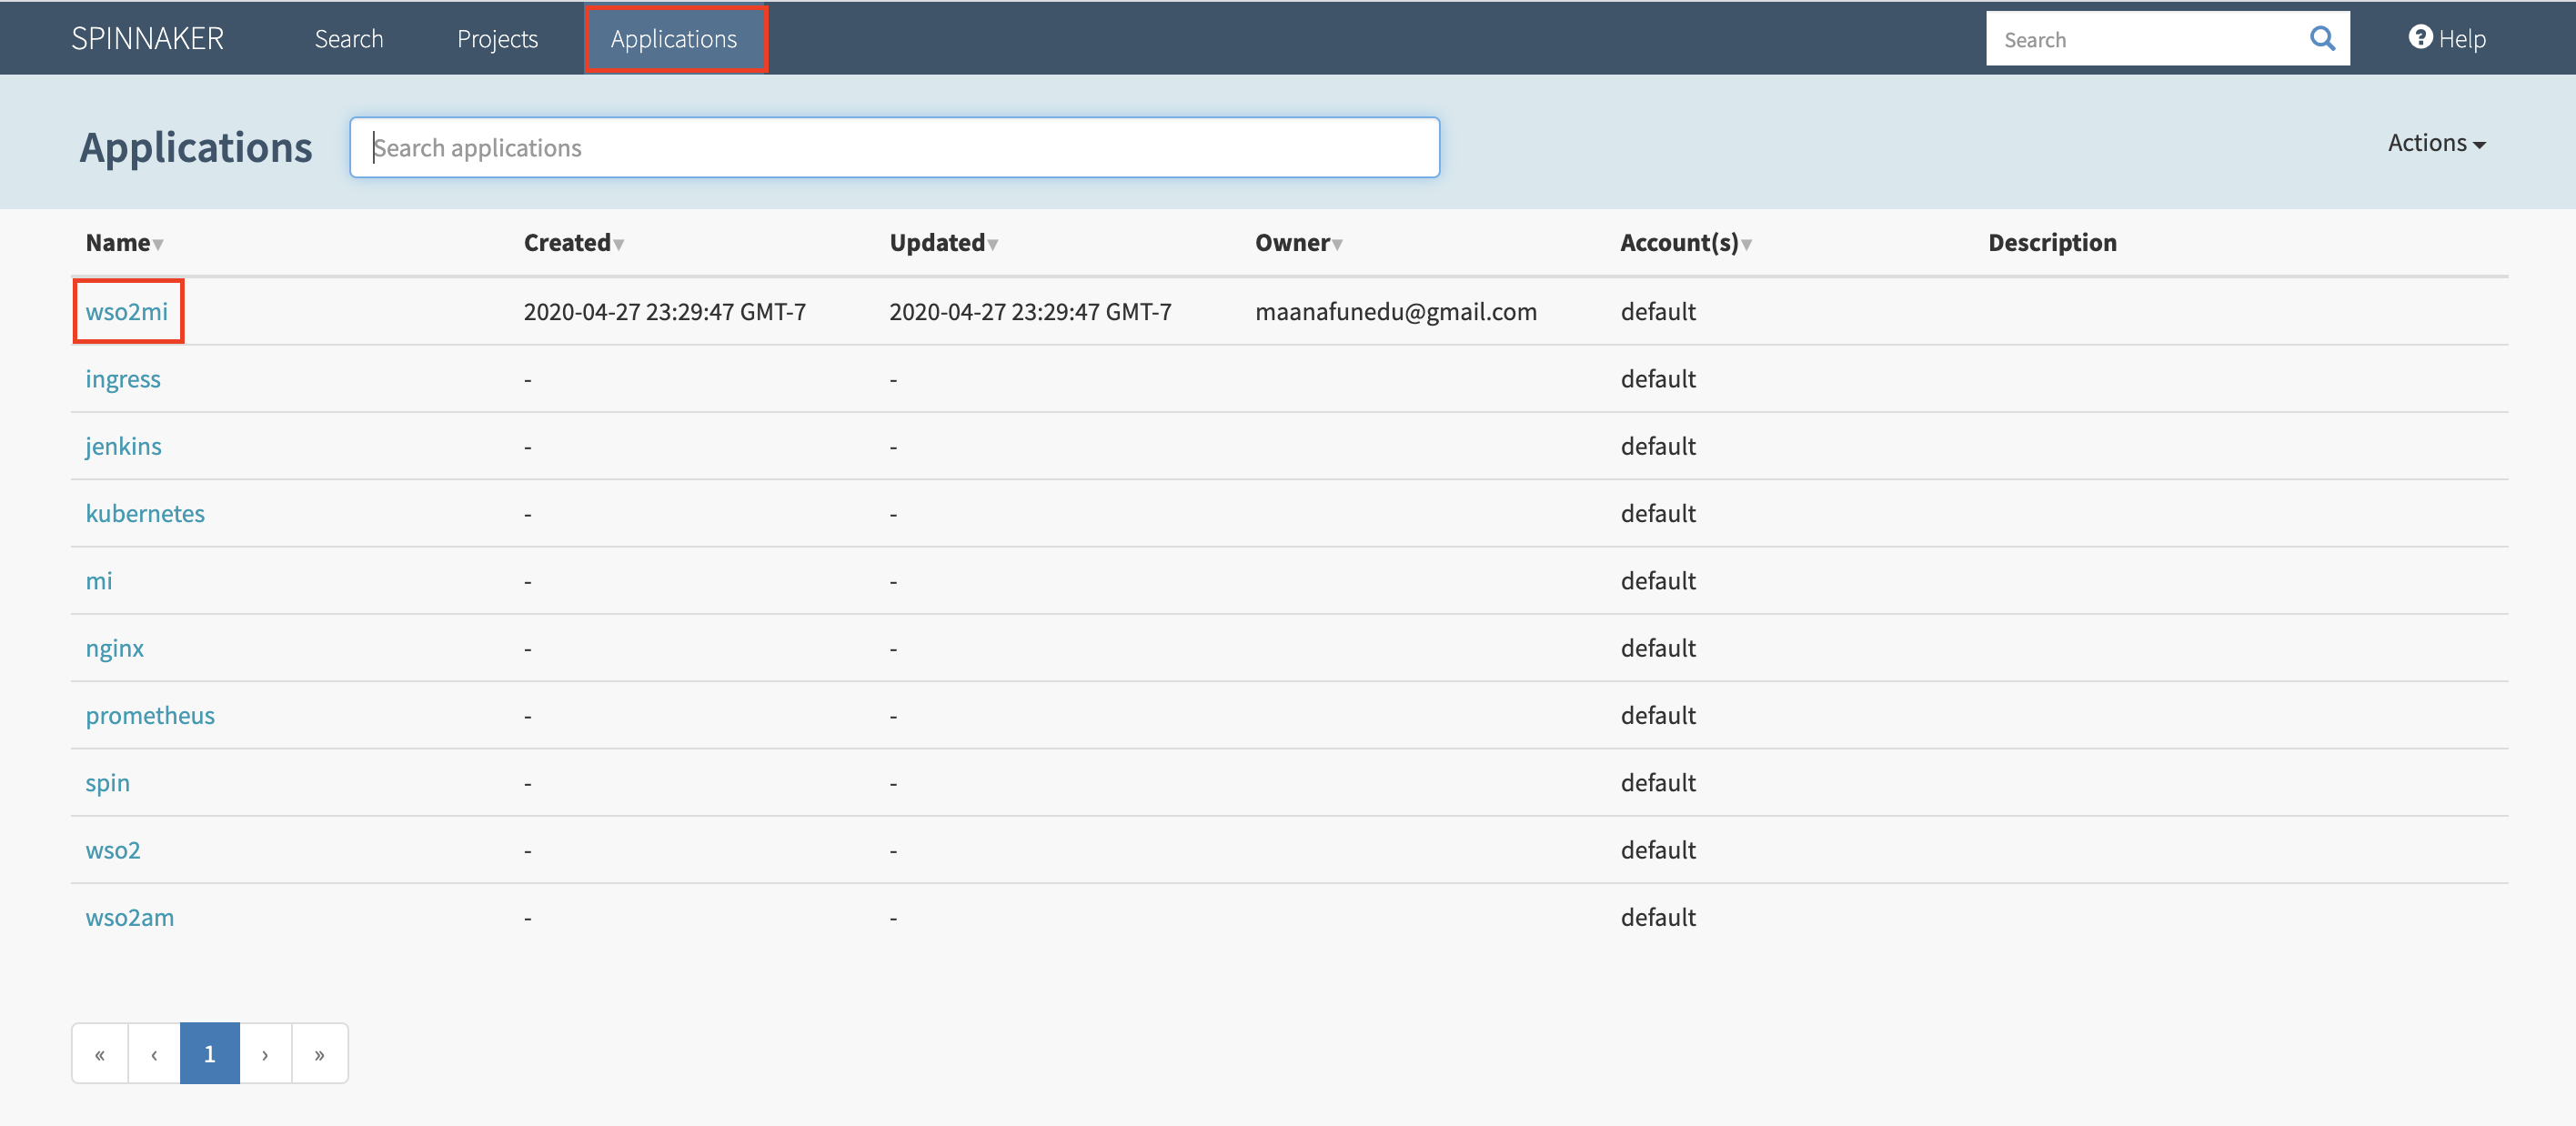
once the user click on the
pipelinetab the pipeline details will be displayed. Refer the below image: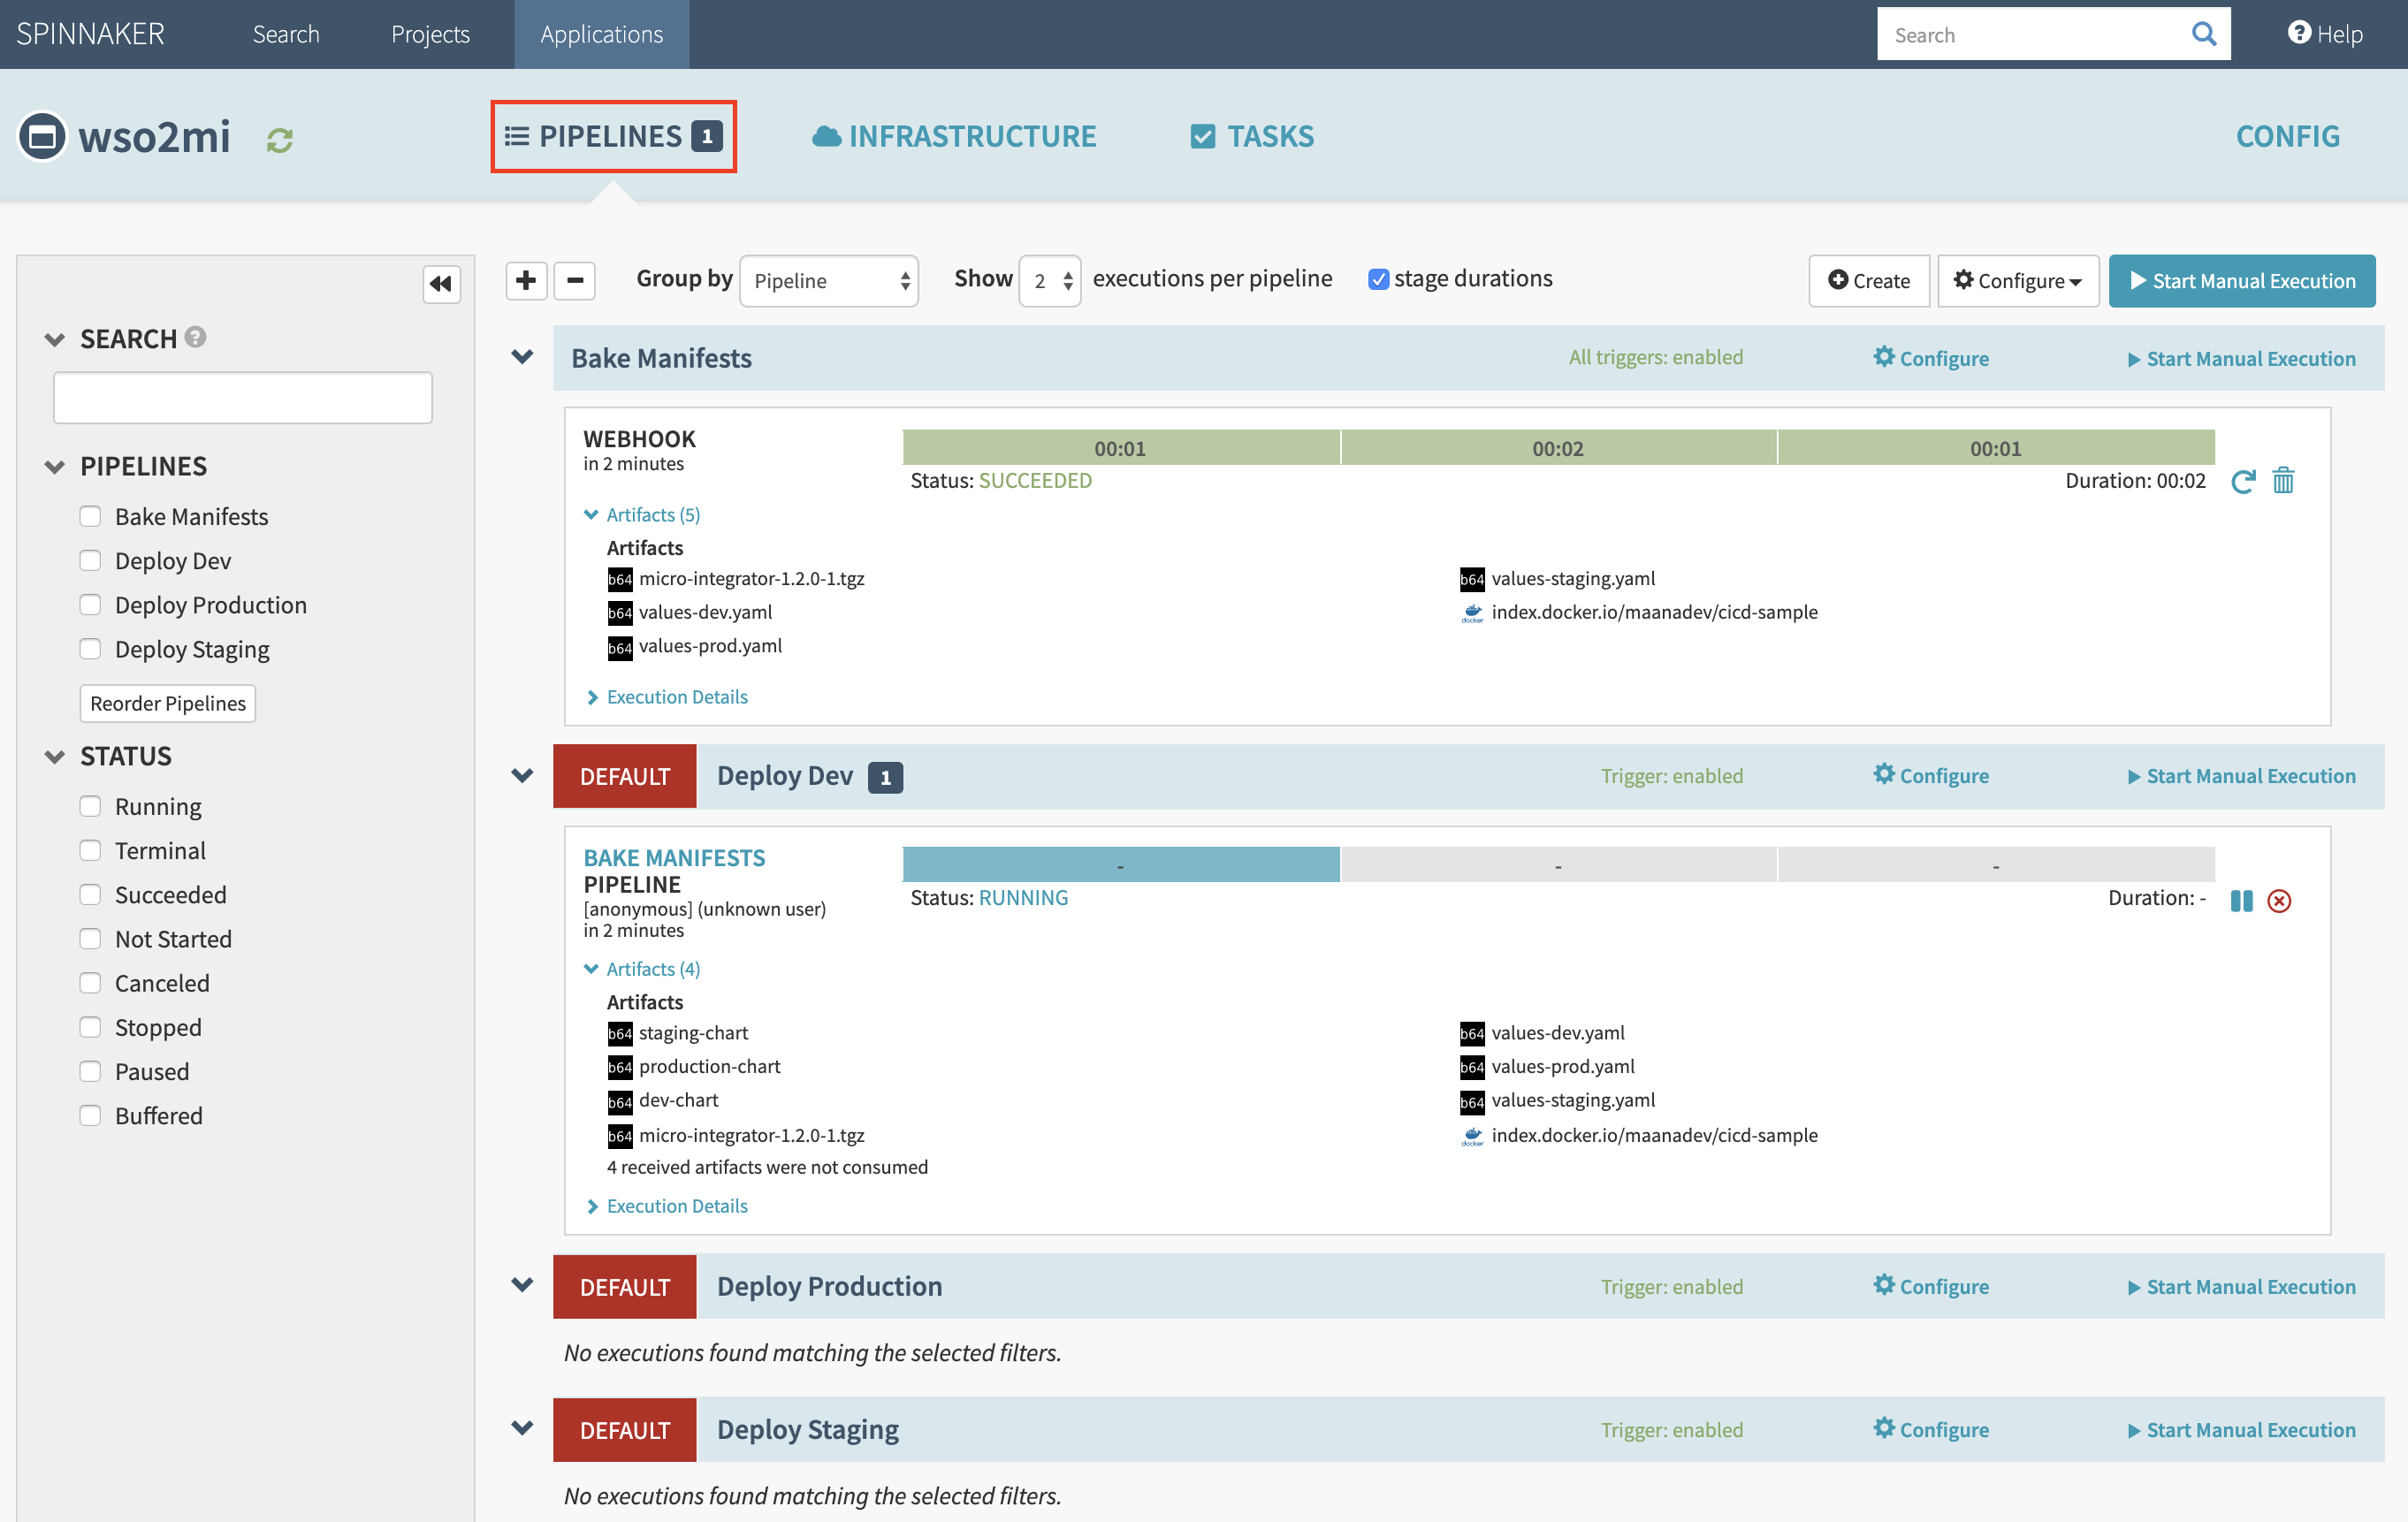
The Spinnaker dashboard for a particular product shows the progress of the deployment.
You are presented with three pipelines where one is active.
-
Deploy Dev : Pipeline responsible for executing the tasks in deploying the changes to Dev environment and it's active by default.
-
Deploy Staging : Pipeline responsible for executing the tasks in deploying the changes to the Staging environment.
-
Deploy Prod : Pipeline responsible for executing the tasks in deploying the changes to the Production environment.
Once the changes have been deployed to the Dev environment, you will be prompted to provide a manual input in order to proceed and to make a deployment to Staging.
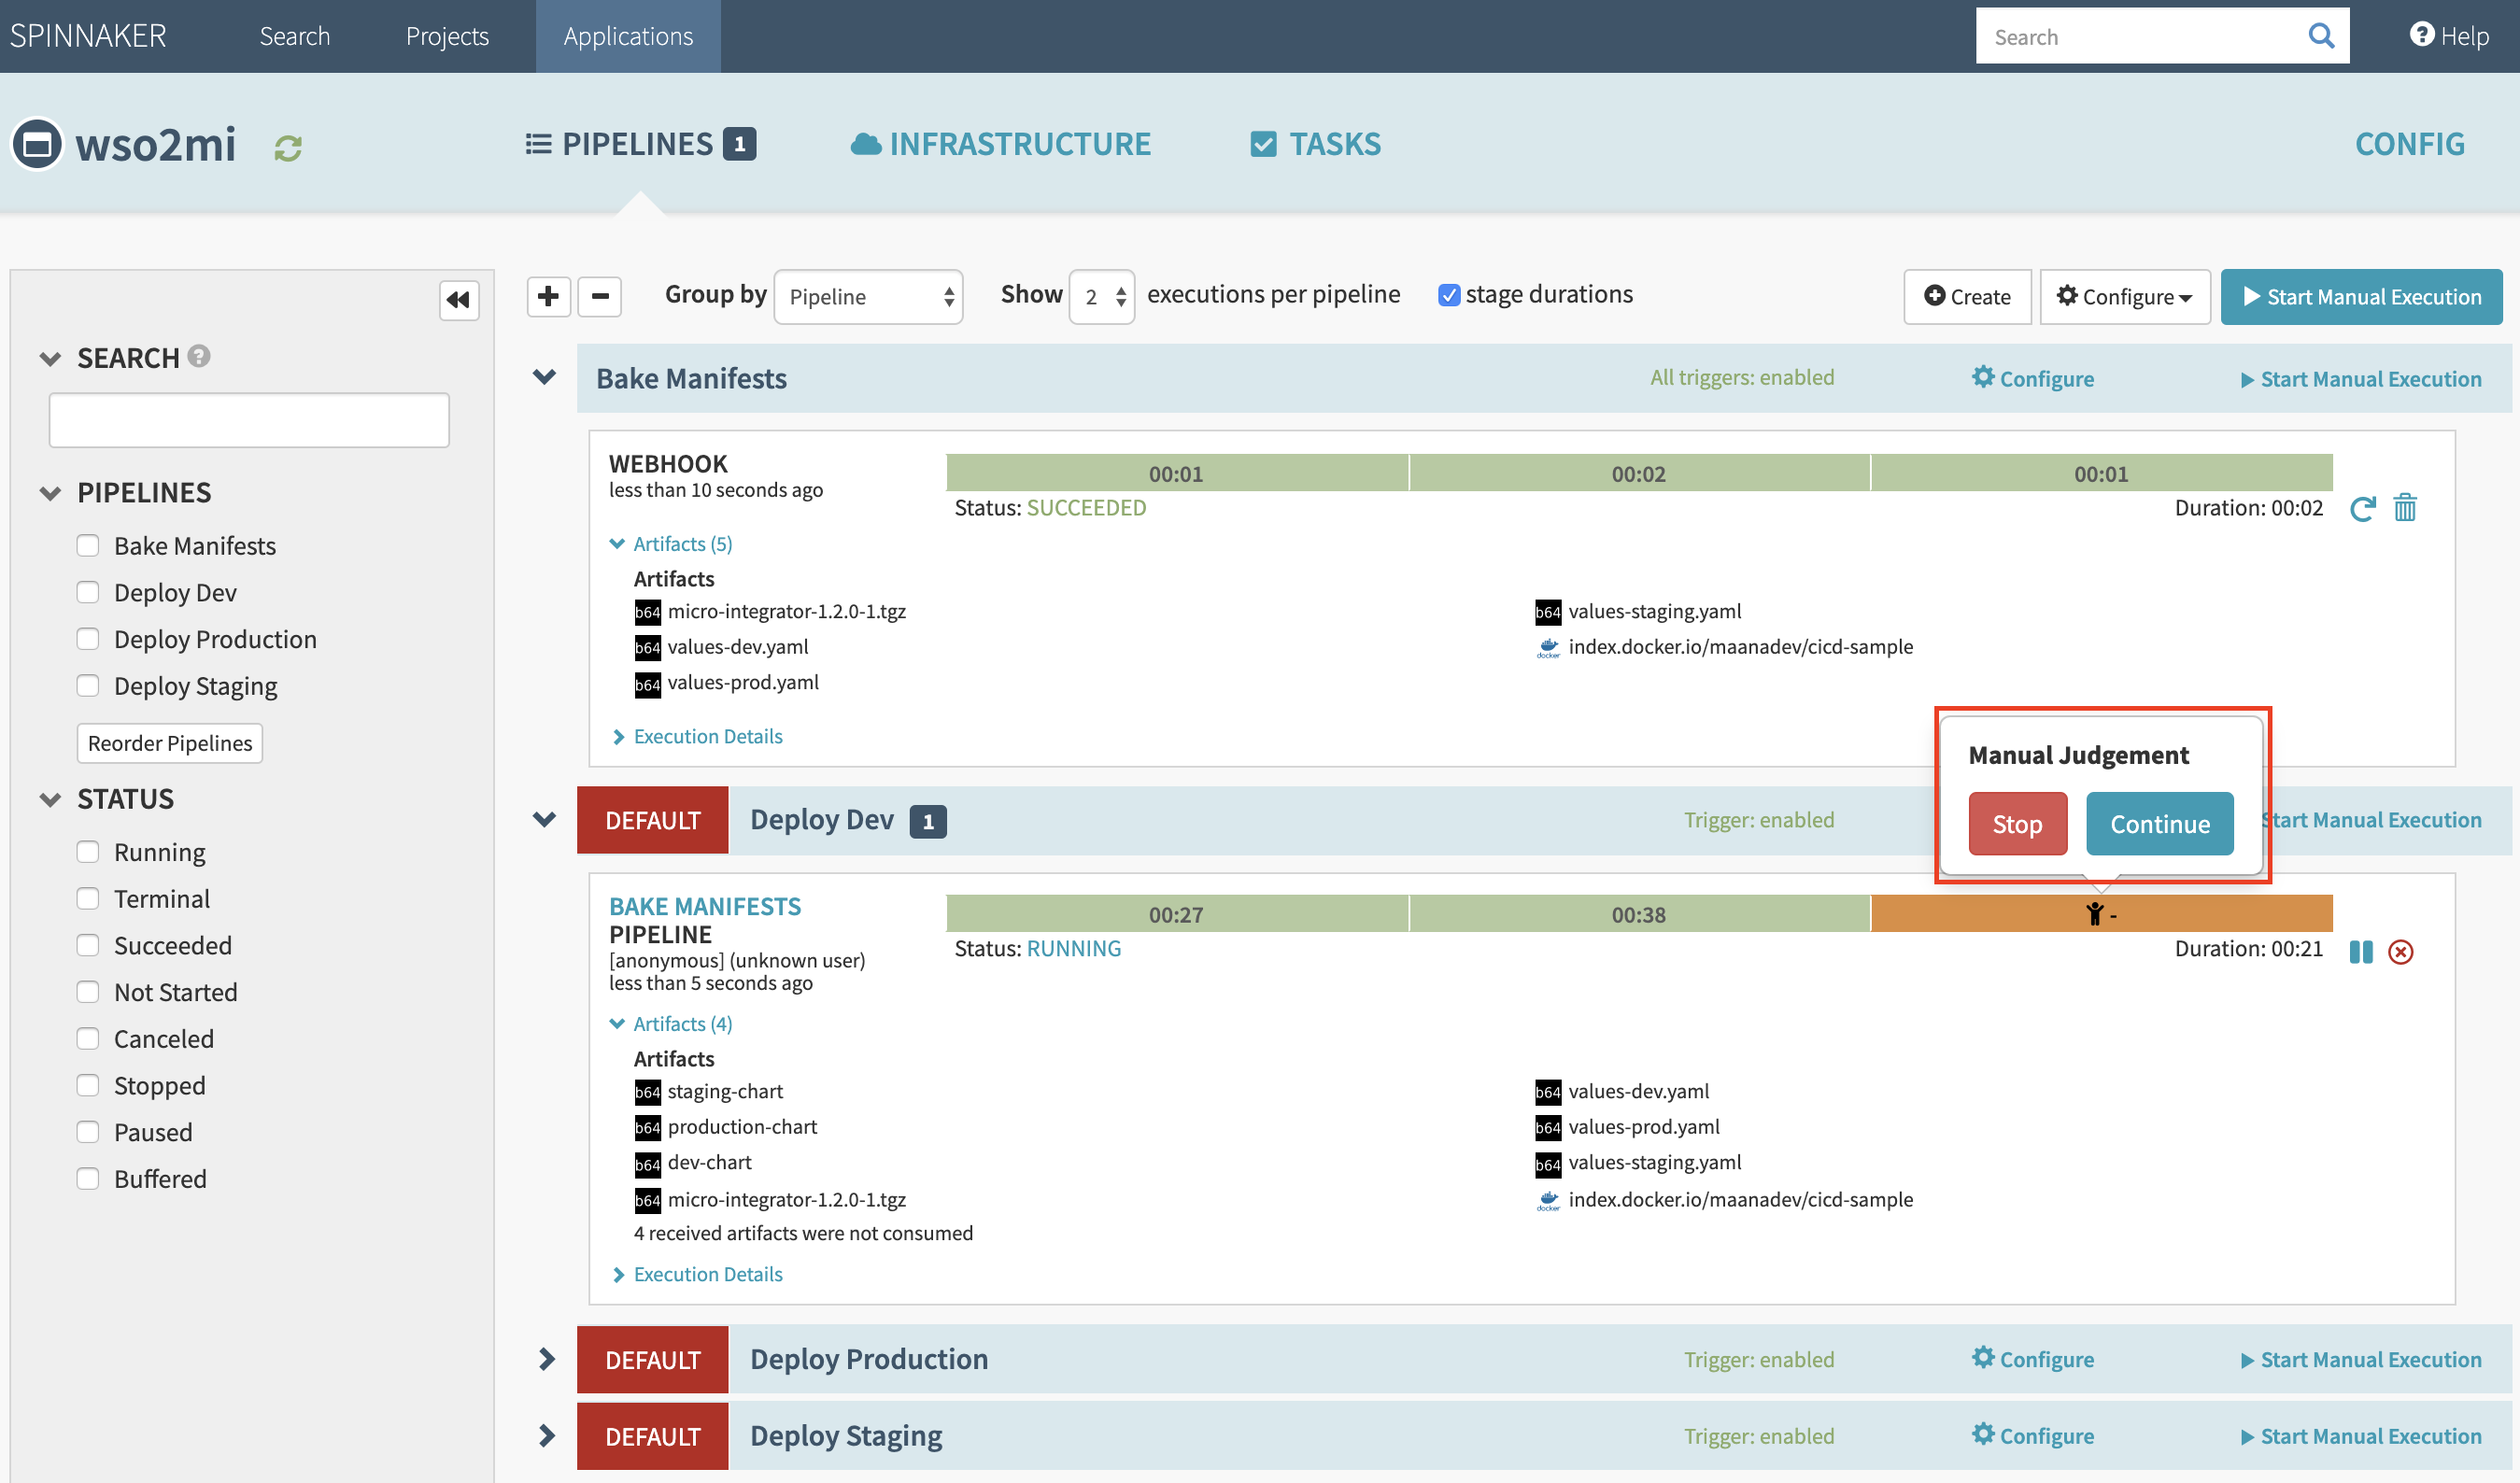
Before proceeding with the manual judgment, let's examine our WSO2 Micro Integrator deployment in the Dev environment.
Navigate to Infrastructure tab > Load Balancers > ingress wso2mi-dev-micro-integrator.
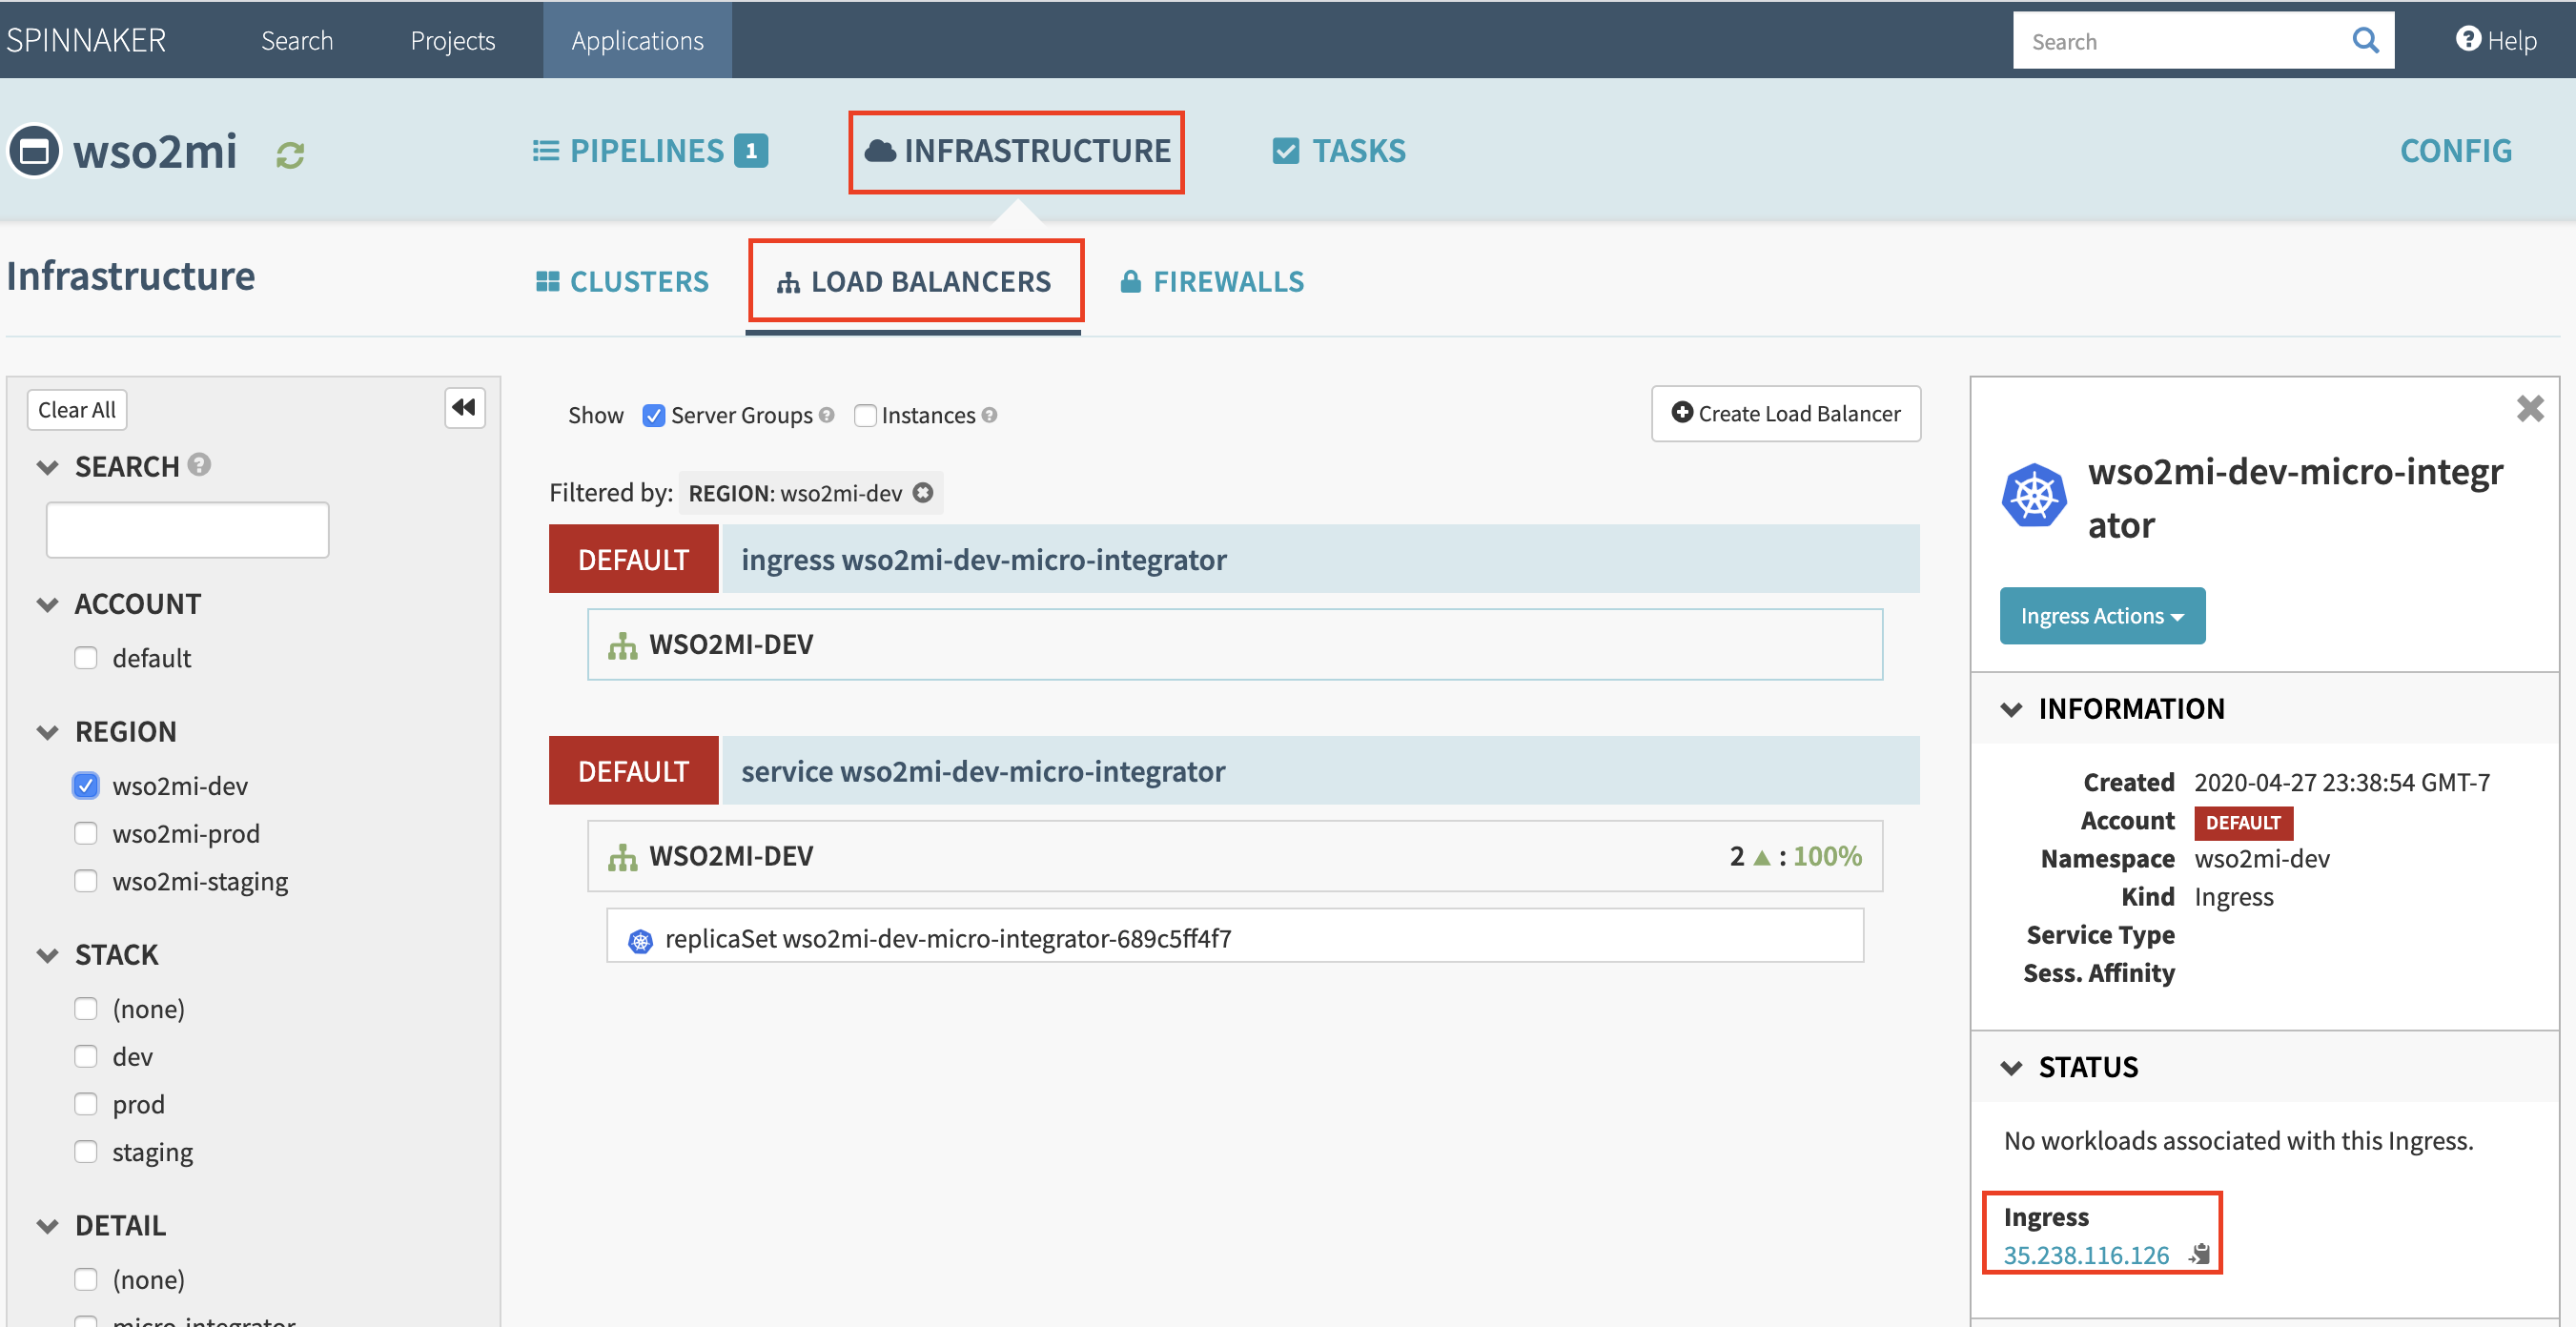
Ingress information of current deployments can be observed here. The Ingress IP address of the Micro Integrator Dev environment can be obtained from the sidebar to the right.
-
Invoking Services
Send the following request through a Curl command and observe the output.
$ curl -k https://mi.dev.wso2.com/services/HelloWorld
You will get the following response: {"Hello":"World"}
Logging
Logging function is implemented in the pipeline utilizing resources provided by Elastic search and Kibana.
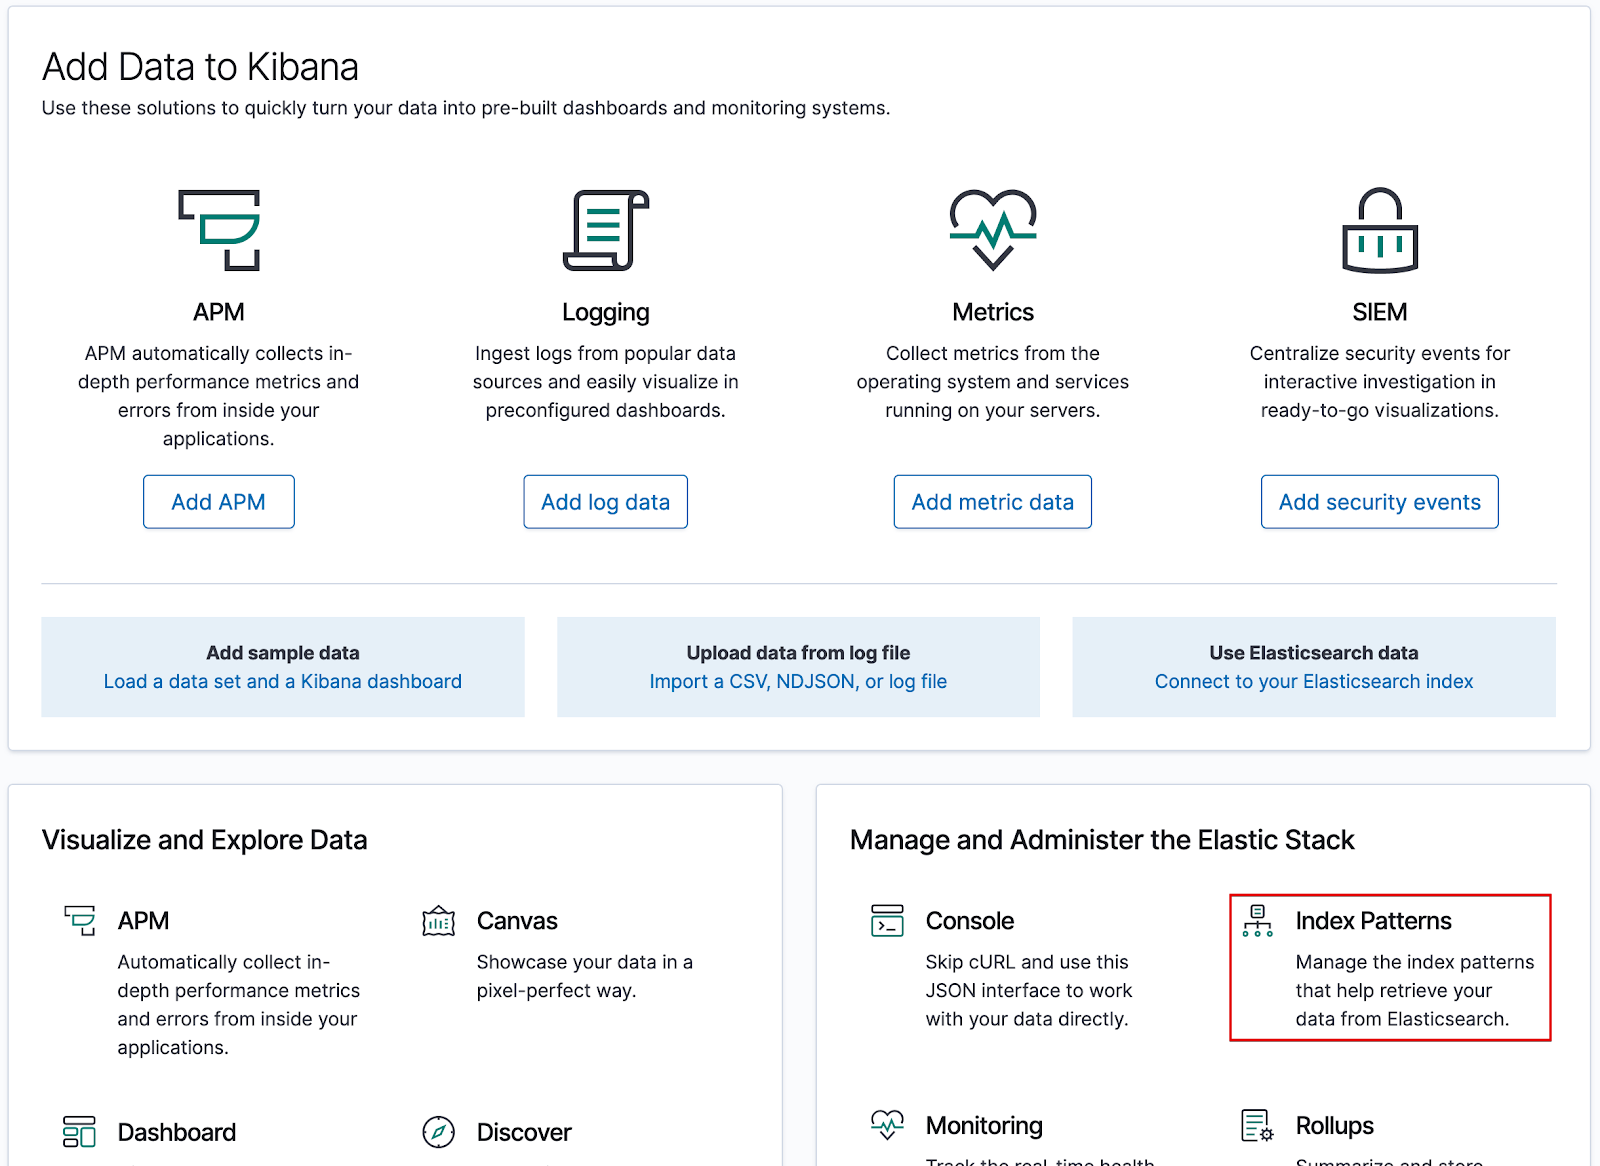
The Kibana dashboard can be accessed by navigating
to https://kibana.example.com on a browser of choice.
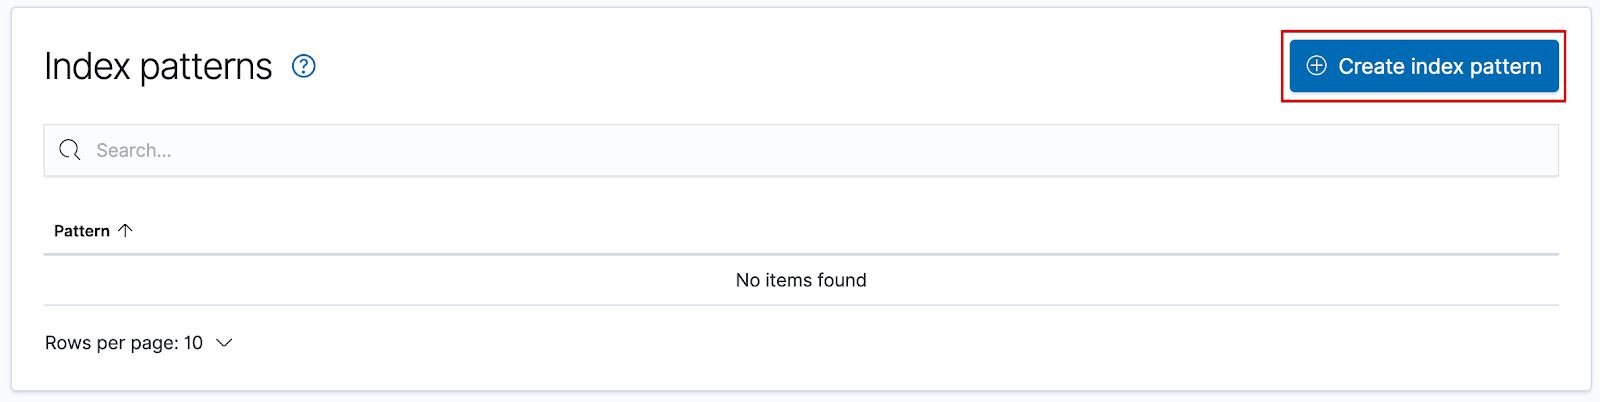
In the dashboard, select Index Patterns,and Click Create index
pattern.
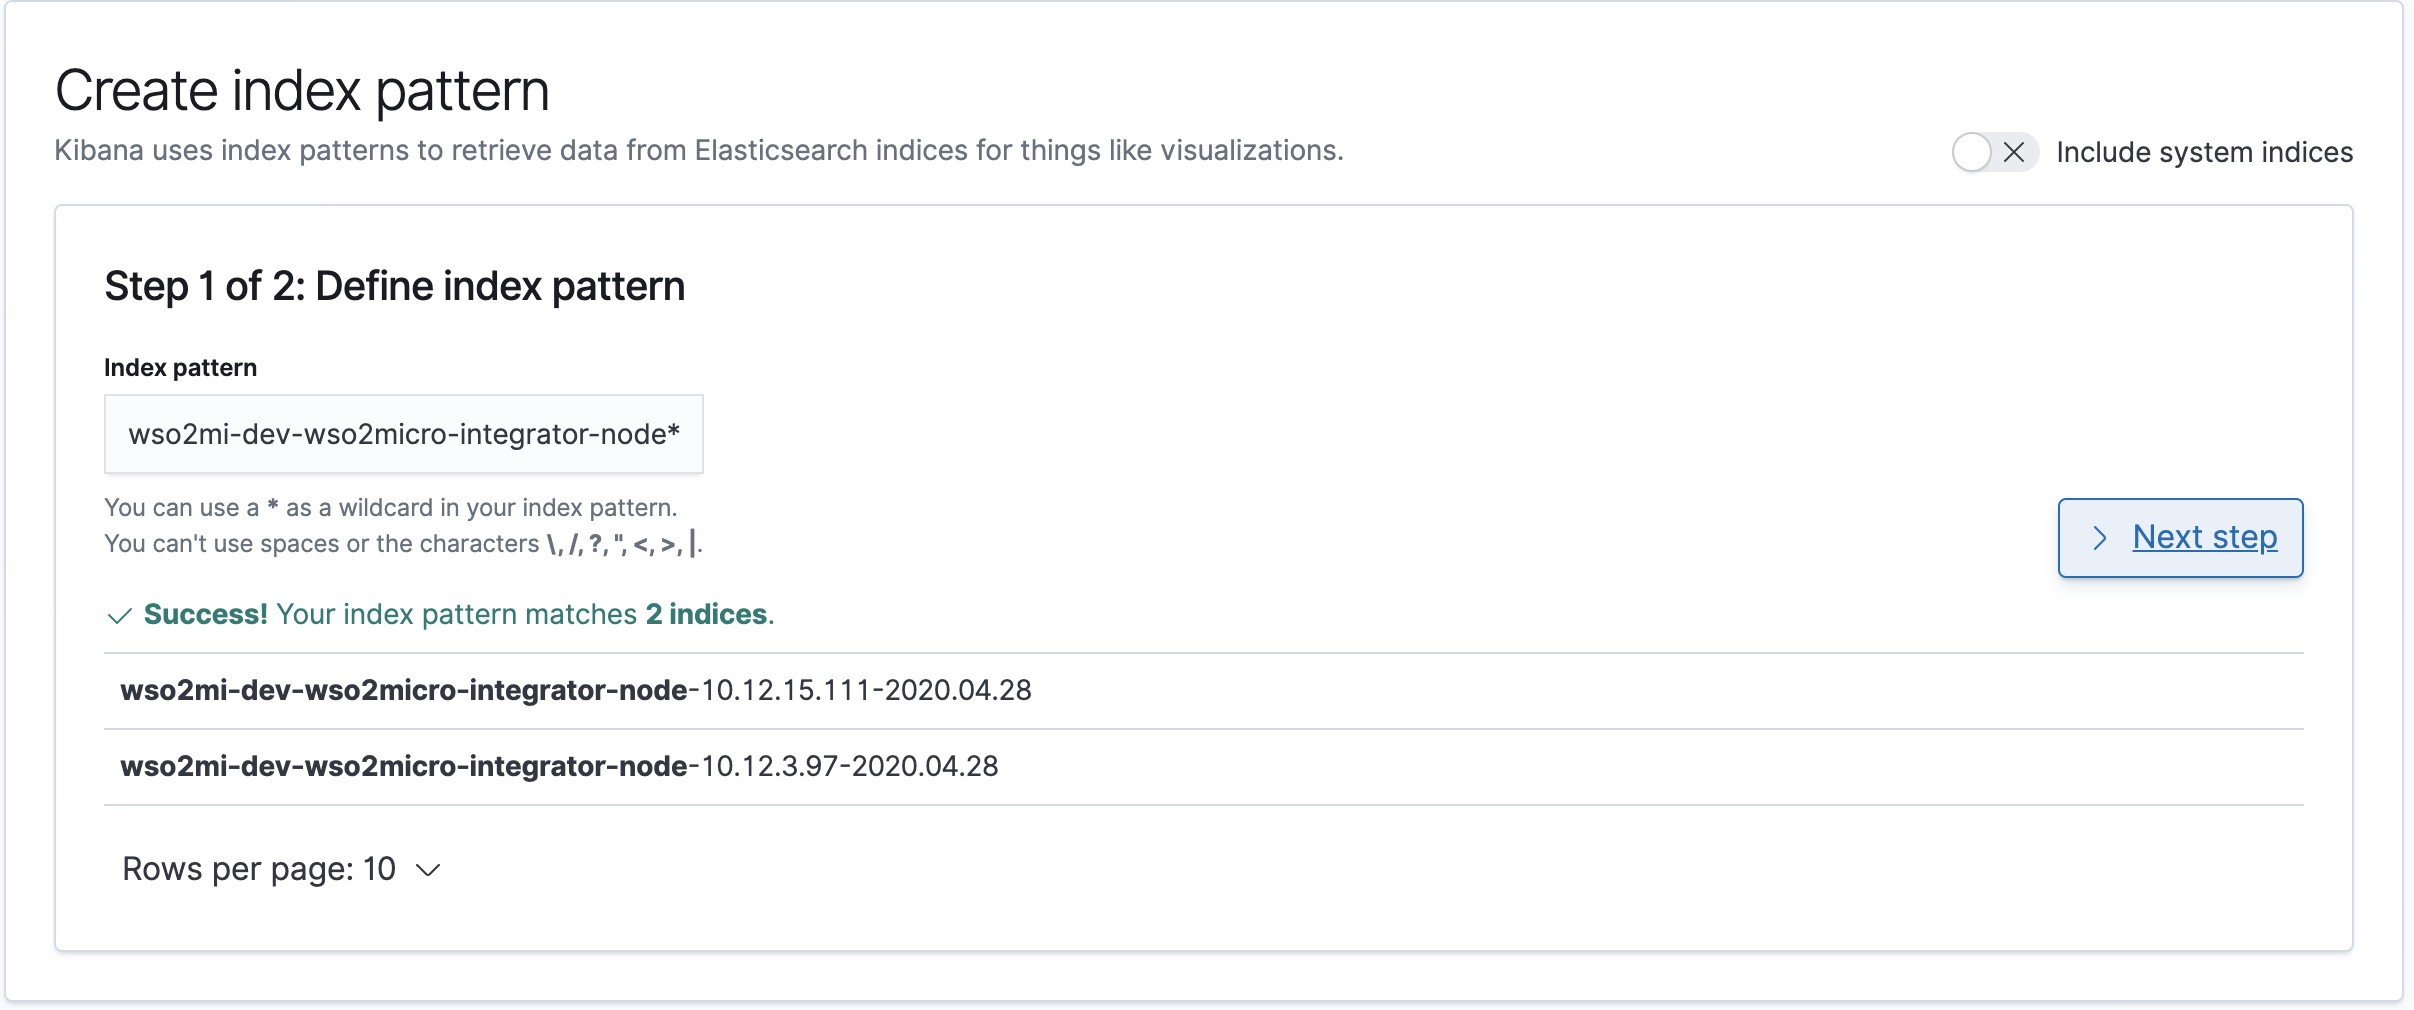
Let’s observe the logs in the Analytics Dashboard.
To do so, provide wso2mi-dev-wso2micro-integrator-node as an index
pattern, andselect Next step
Thereafter, create a filter providing the @timestamp field name.
Once the index pattern is created, Analytics Dashboard logs can be
observed by clicking the Discover button on the left of the page.
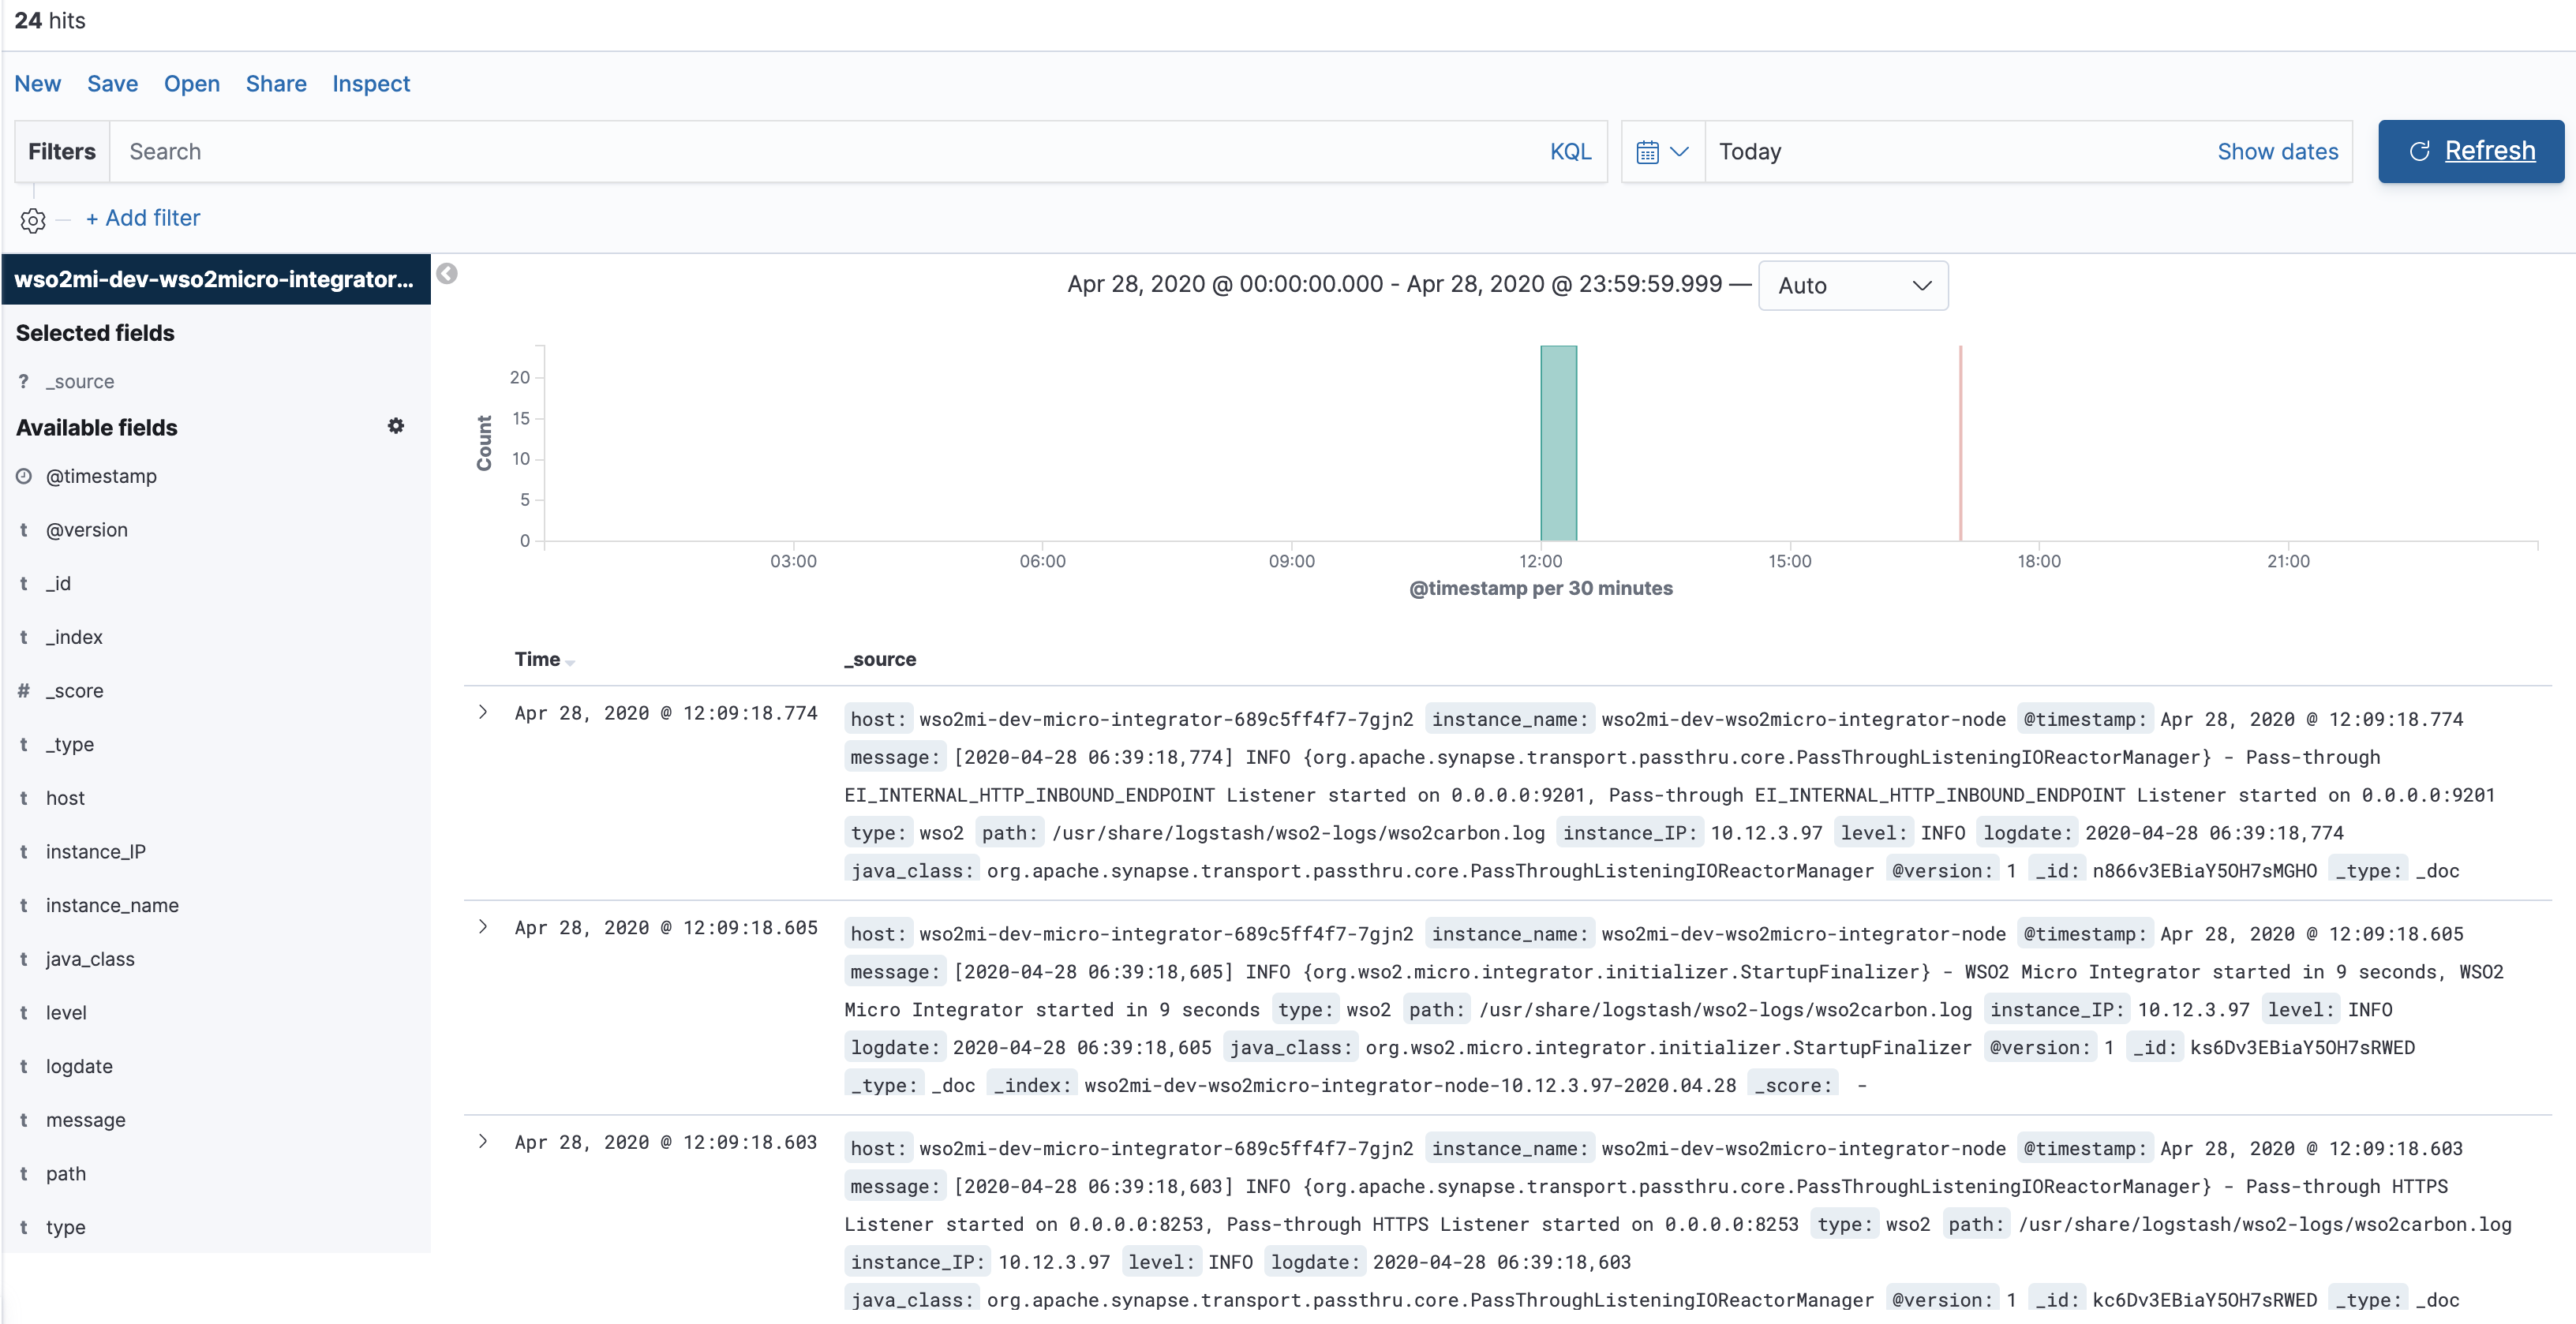
Tip
If no results are visible, expand your time range by selecting the desired range on the top left of the dashboard.