Micro Integrator Dashboard
The Micro Integrator dashboard provides a graphical view of the synapse artifacts that are deployed in a specified Micro Integrator server instance. This dashboard is an alternative to the Micro Integrator CLI, which allows you to monitor your deployments from the command line.
The dashboard as well as the CLI communicates with the management API of WSO2 Micro Integrator to function. Therefore, be sure to enable the Management API in the server before using the management dashboard or the CLI.
Enable the Management API
To use the management dashboard, you need to enable the management API when you start your WSO2 Micro Integrator instance. Pass the following system property:
-DenableManagementApiNote that the default address is https://localhost and the port is 9164.
-
When you run the Micro Integrator on Docker, start your Docker container by passing the
enableManagementApisystem property:docker run -p 8290:8290 -p 9164:9164 -e JAVA_OPTS="-DenableManagementApi=true" <Docker_Image_Name> -
When you run the Micro Integrator on a VM, use the following command to enable the
enableManagementApisystem property:sh micro-integrator.sh -DenableManagementApi -
The Management API is enabled for the embedded Micro Integrator in WSO2 Integration Studio by default.
Install and run the dashboard
Warning
In a non-production environment (with the self signed certificate), you have to add the certificate of the micro integrator instance to the browser as a trusted source. For example, direct the browser to https://localhost:9164/management and add the site as trusted. This step will not be required with a custom production certificate.
- To download the dashboard, go to WSO2 Micro Integrator website -> Download -> Other Resources, and click Monitoring Dashboard.
- Extract the downloaded ZIP file. This will be the
MI_DASHBOARD_HOMEdirectory. -
Open a terminal, navigate to the
MI_DASHBOARD_HOME/bindirectory, and execute the following command to start the dashboard server:
The dashboard server will start as follows.sh dashboard.shWeb app 'dashboard' is available at 'https://127.0.0.1:9743/dashboard -
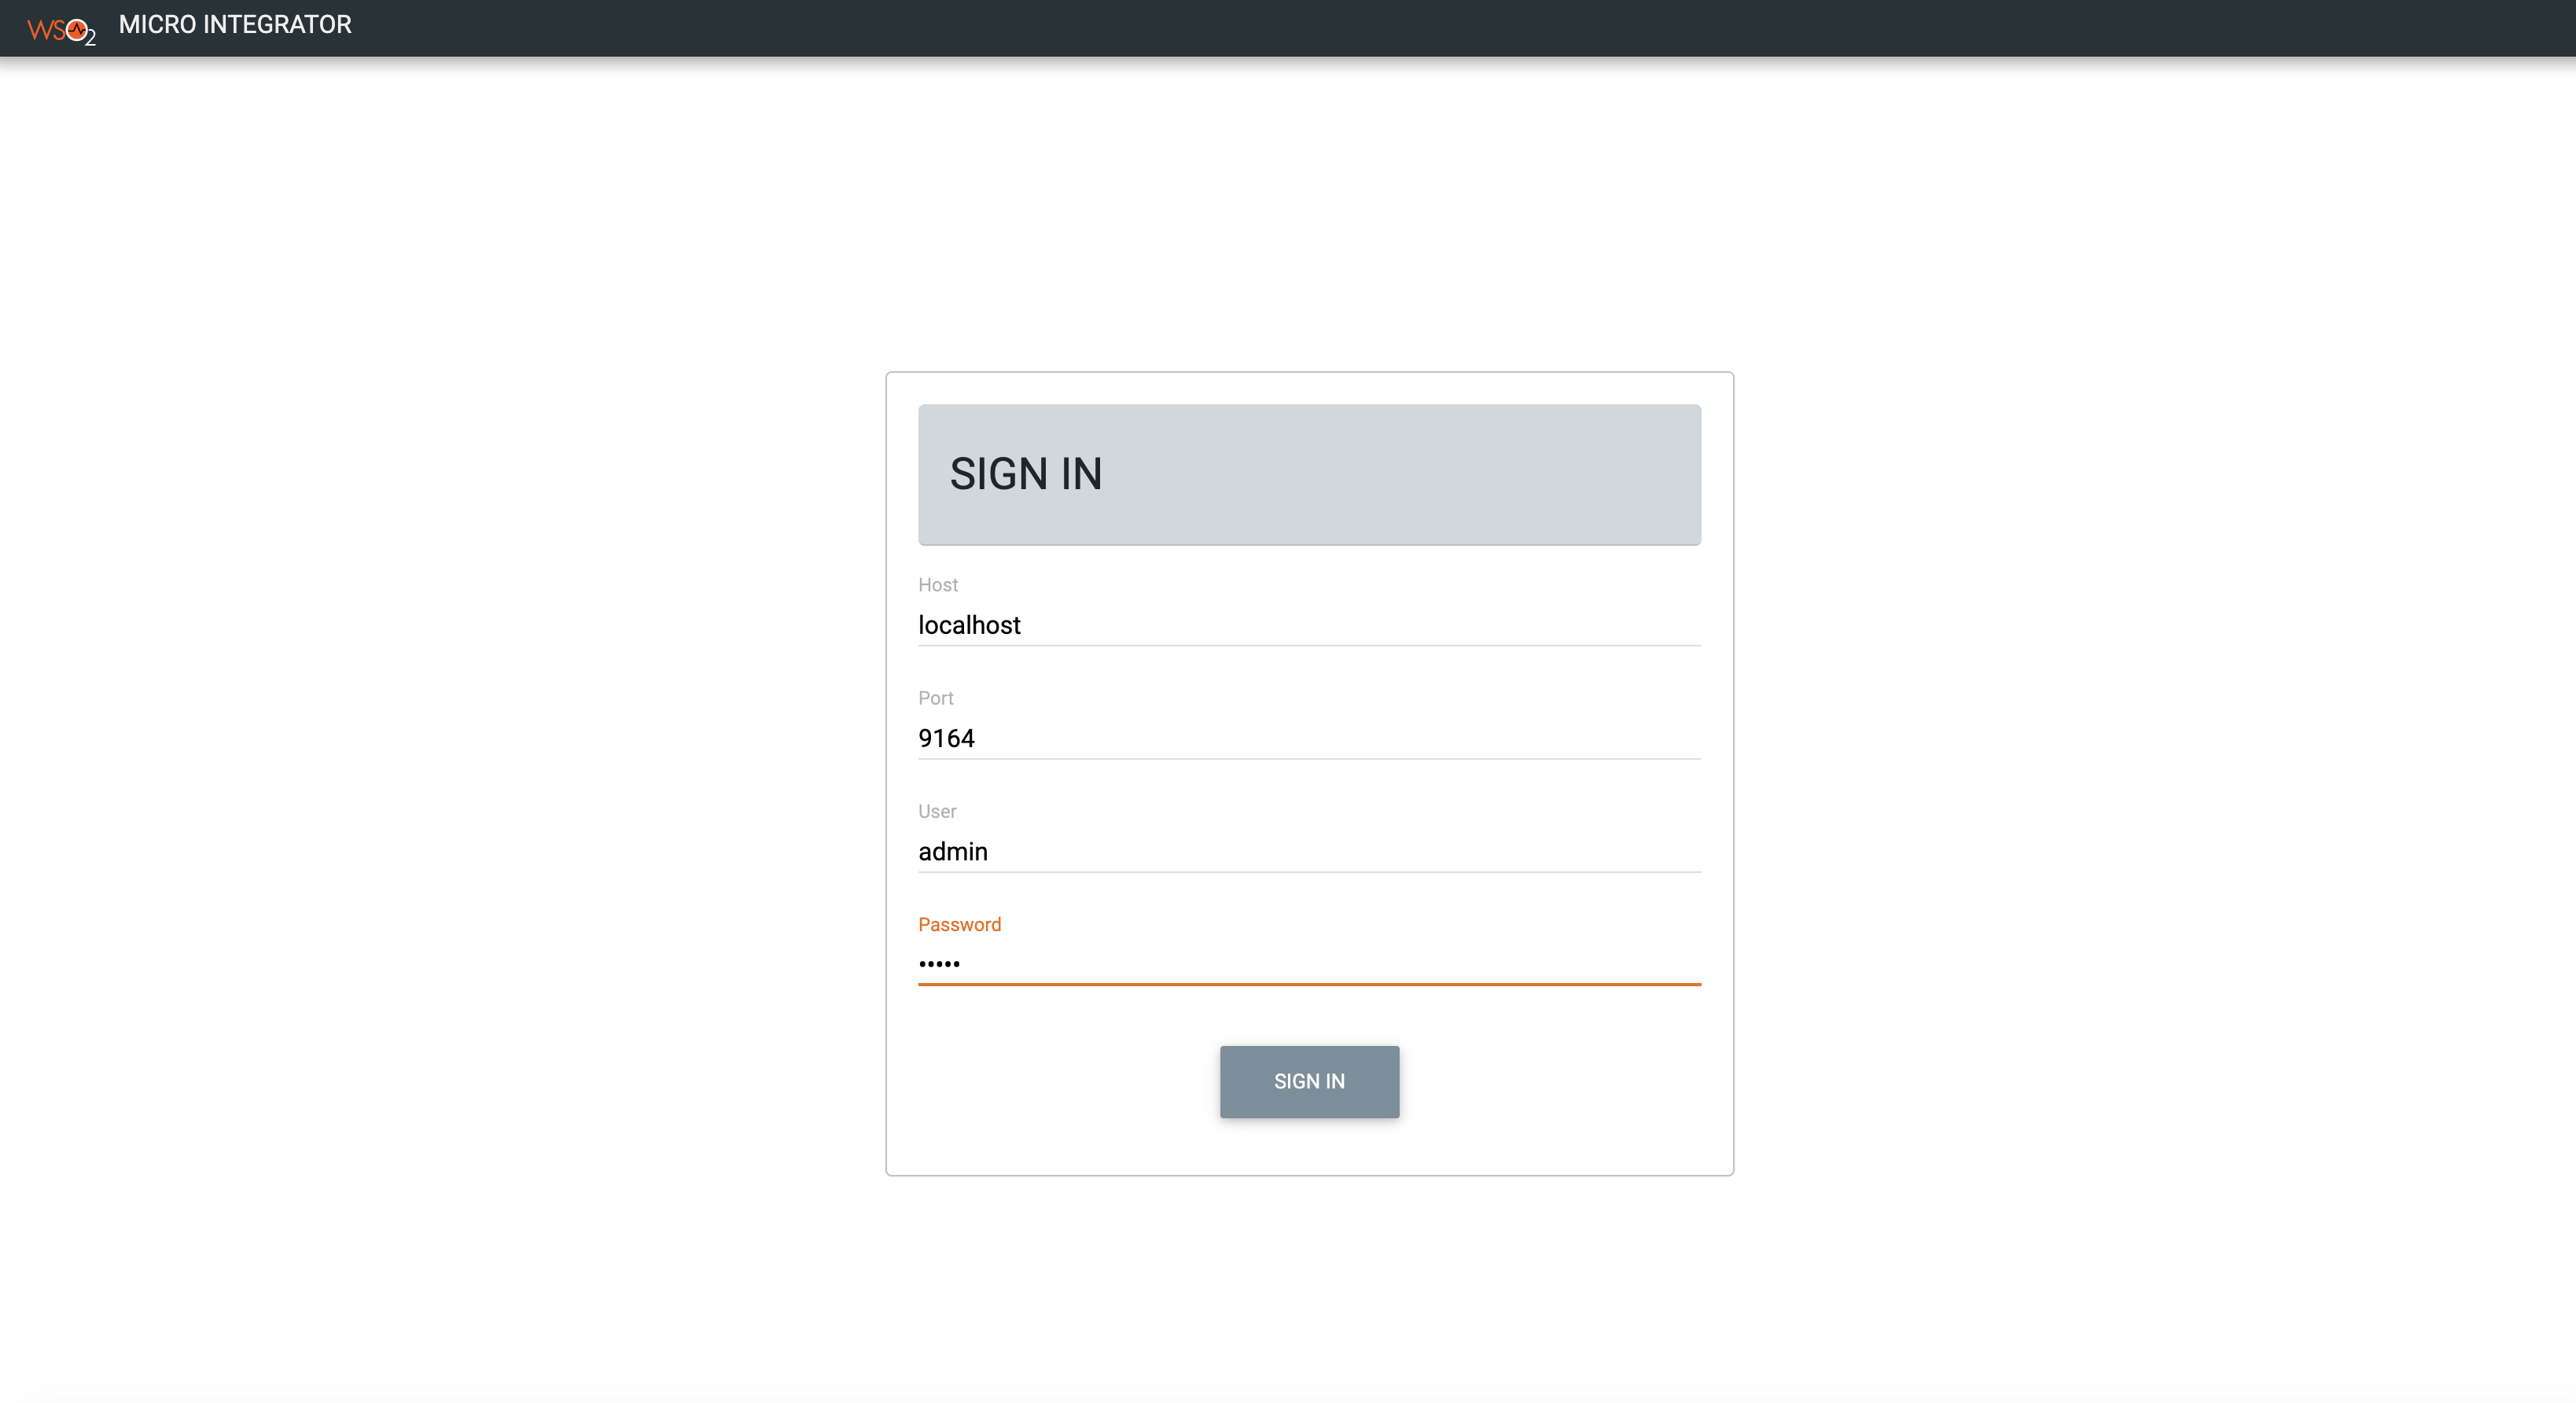
Log in to the dashboard using the following:
https://127.0.0.1:9743/dashboard/login -
Enter your credentials to log in:
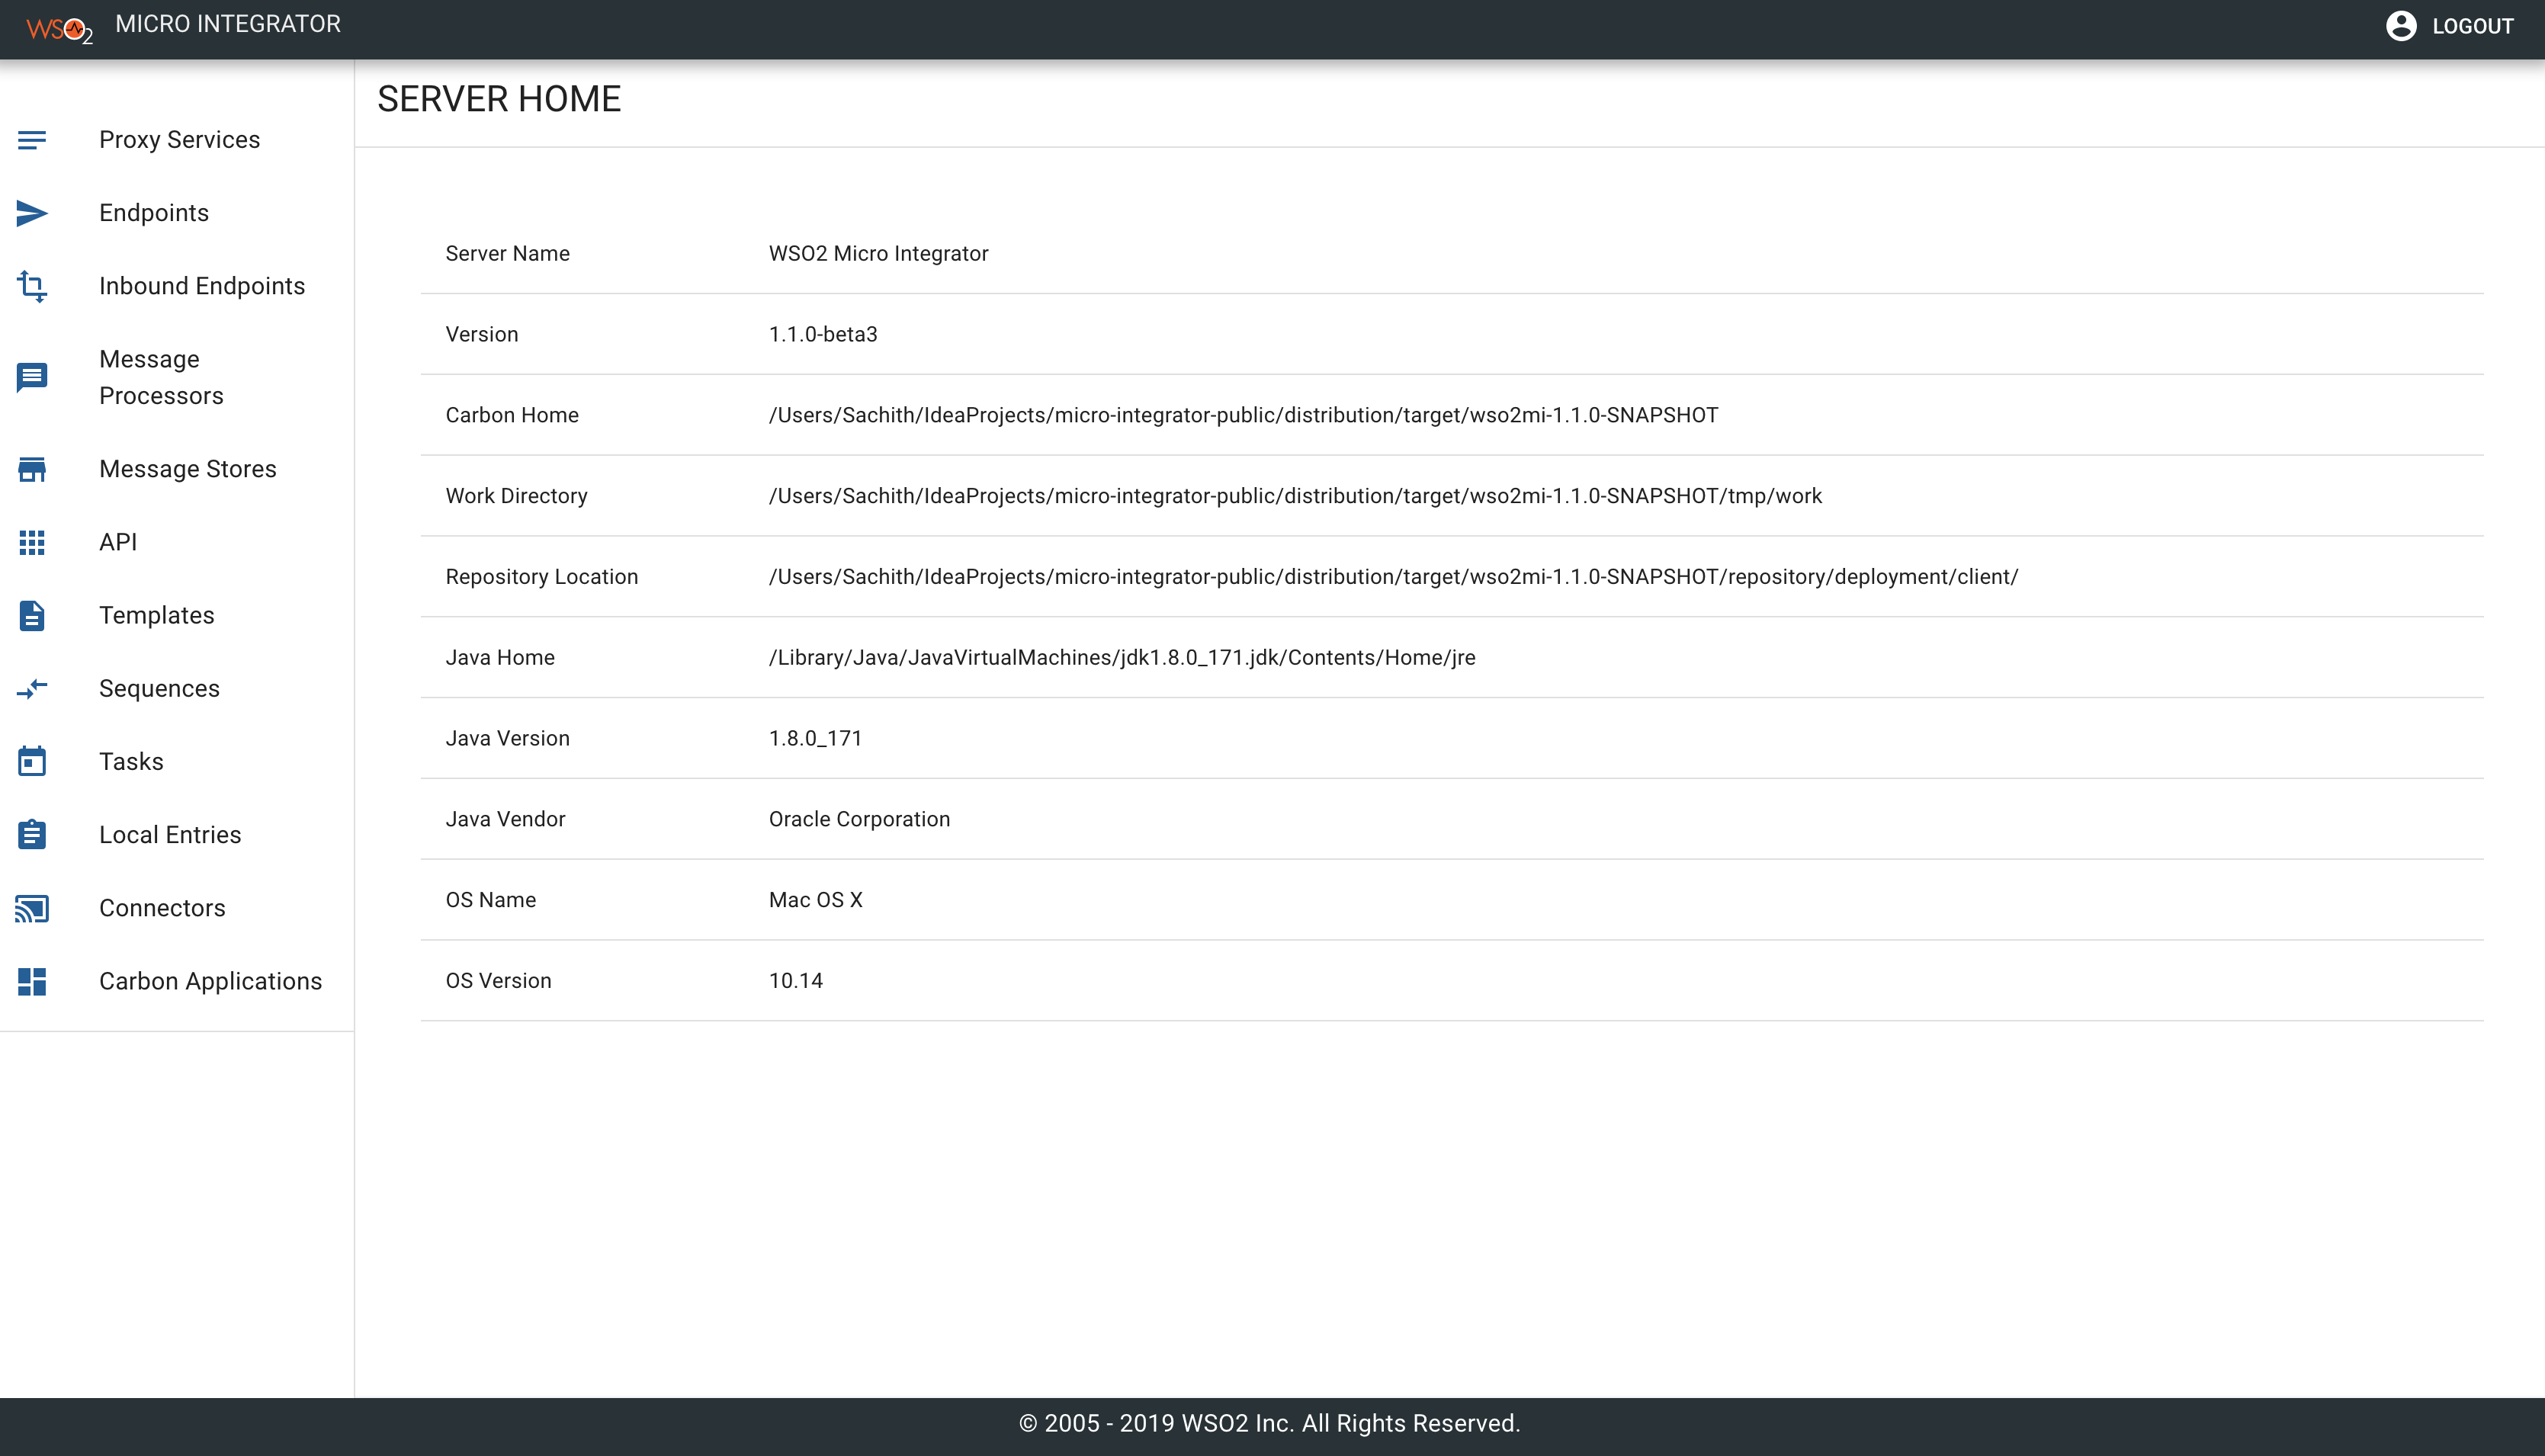
After a successful login, you will be redirected to the home page from where you can browse the deployed artifacts in the micro integrator server instance.
Configure dashboard security (Optional)
See Securing the Management API.
Top