Monitoring Statistics and Tracing
Monitoring the usage of the integration runtime using statistical information is very important for understanding the overall health of a system that runs in production. Statistical data helps to do proper capacity planning, to keep the runtimes in a healthy state, and for debugging and troubleshooting problems. When it comes to troubleshooting, the ability to trace messages that pass through the mediation flows of the Micro Integrator is very useful. For monitoring statistics and tracing, we can use the Analytics profile of WSO2 Enterprise Integrator 6.x family.
You can monitor the following statistics through the EI Analytics profile:
- Request Count
- Overall TPS
- Overall Message Count
- Top Proxy Services by Request Count
- Top APIs by Request Count
- Top Endpoints by Request Count
- Top Inbound Endpoints by Request Count
- Top Sequences by Request Count
Please see this documentation for more information on what you can monitor using EI Analytics.
The Analytics profile consists of two components: Worker and Dashboard. The worker is the server that processes the data streams that are sent from the Micro Integrator and publishes the statistics to a database. The dashboard reads the statistics published by the worker and displays the statistics. The worker and dashboard are connected through the database.
See the instructions given below on using the Analytics profile with the Micro Integrator.
System Requirements
-
For EI nodes, see Installation Prerequisites.
-
For the Analytics worker:
Memory - ~ 2 GB per worker node (and therefore, 4 GB for the recommended Minimum HA cluster
- 2 CPU cores minimum. It is recommended to allocate 4 cores.
- ~ 2 GB is the initial heap (-Xms) required for the server startup. The maximum heap size is 4 GB (-Xmx)
Disk - ~ 480 MB, excluding space allocated for log files and databases.
-
For the Analytics Dashboard:
Memory - ~ 2 GB minimum, 4 GB Maximum
- 2 CPU cores minimum. It is recommended to allocate 4 cores.
- ~ 512 MB heap size. This is generally sufficient to process typical SOAP messages but the requirements vary with larger message sizes and the number of messages processed concurrently.
Disk - ~ 480 MB, excluding space allocated for log files and databases.
Configuring the Micro Integrator
To enable statistics monitoring for the Micro Integrator, add the following parameters in the deployment.toml file of your Micro Integrator. This file is stored in the MI_HOME/conf.
Tip
When you run the embedded Micro Integrator of WSO2 Integration Studio, the MI_HOME/conf directory is as follows: MI_TOOLING_HOME/Contents/Eclipse/runtime/microesb/conf/ (in MacOS/Linux/CentOS) or MI_TOOLING_HOME/runtime/microesb/conf (in Windows) directory.
[mediation]
flow.statistics.enable=true
stat.tracer.collect_payloads=true
stat.tracer.collect_mediation_properties=true
Configuring the Micro Integrator to Publish Data to Analytics Server
Note
Upgrade Micro Integrator to the latest WUM level to enable this feature. If not, the default values will be used for server_url and auth_server_url.
Analytics publishing can be configured in the [monitoring] section of the <MI_HOME>/conf/deployment.toml file as shown below.
Note
By default, the Micro Integrator is internally configured (with the following) to connect with an EI Analytics server running on the same VM. To change the default setup, you need to add the following to the deployment.toml file and update the values.
[monitoring]
ei_analytics.server_url = "tcp://localhost:7612"
ei_analytics.auth_server_url = "ssl://localhost:7712"
ei_analytics.username = "admin"
ei_analytics.password = "admin"
If the Analytics nodes run in cluster mode or in different VMs, you can configure the ei_analytics.server_url and the ei-analytics.auth_server_url parameters in a load balancing manner. For more information, see, Enabling Load Balancing Data Agent for Publishing to Analytics
Enabling statistics for artifacts
You must enable statistics/tracing for the integration artifacts that you wish to monitor.
Enabling statistics for ALL artifacts
If you want to collect statistics for all your integration artifacts, be sure to add the following parameter to the deployment.toml file in addition the parameters explained above:
[mediation]
flow.statistics.capture_all=true
Alternatively, you can enable statistics for selected artifacts as explained below.
Enabling statistics for specific artifacts
Let's use the integration artifacts from the service chaining tutorial.
Warning
It is not recommended to enable tracing in production environments as it generates a large number of events that reduces the performance of the analytics profile. Therefore, tracing should only be enabled in development environments.
If you did not try the service chaining tutorial yet:
- Download the pre-packaged project for the service chaining use case.
- Open WSO2 Integration Studio and import the pre-packaged project.
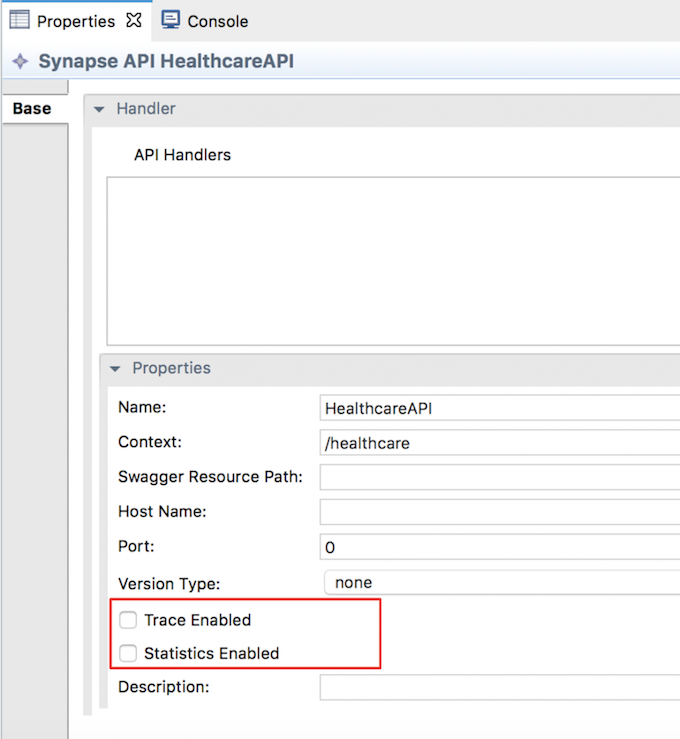
Follow the steps below to enable statistics and tracing for the REST API artifact:
- Select
HealthcareAPIin the canvas of WSO2 Integration Studio to open the Properties tab. - Select Statistics Enabled and (if required) Trace Enabled as shown below.
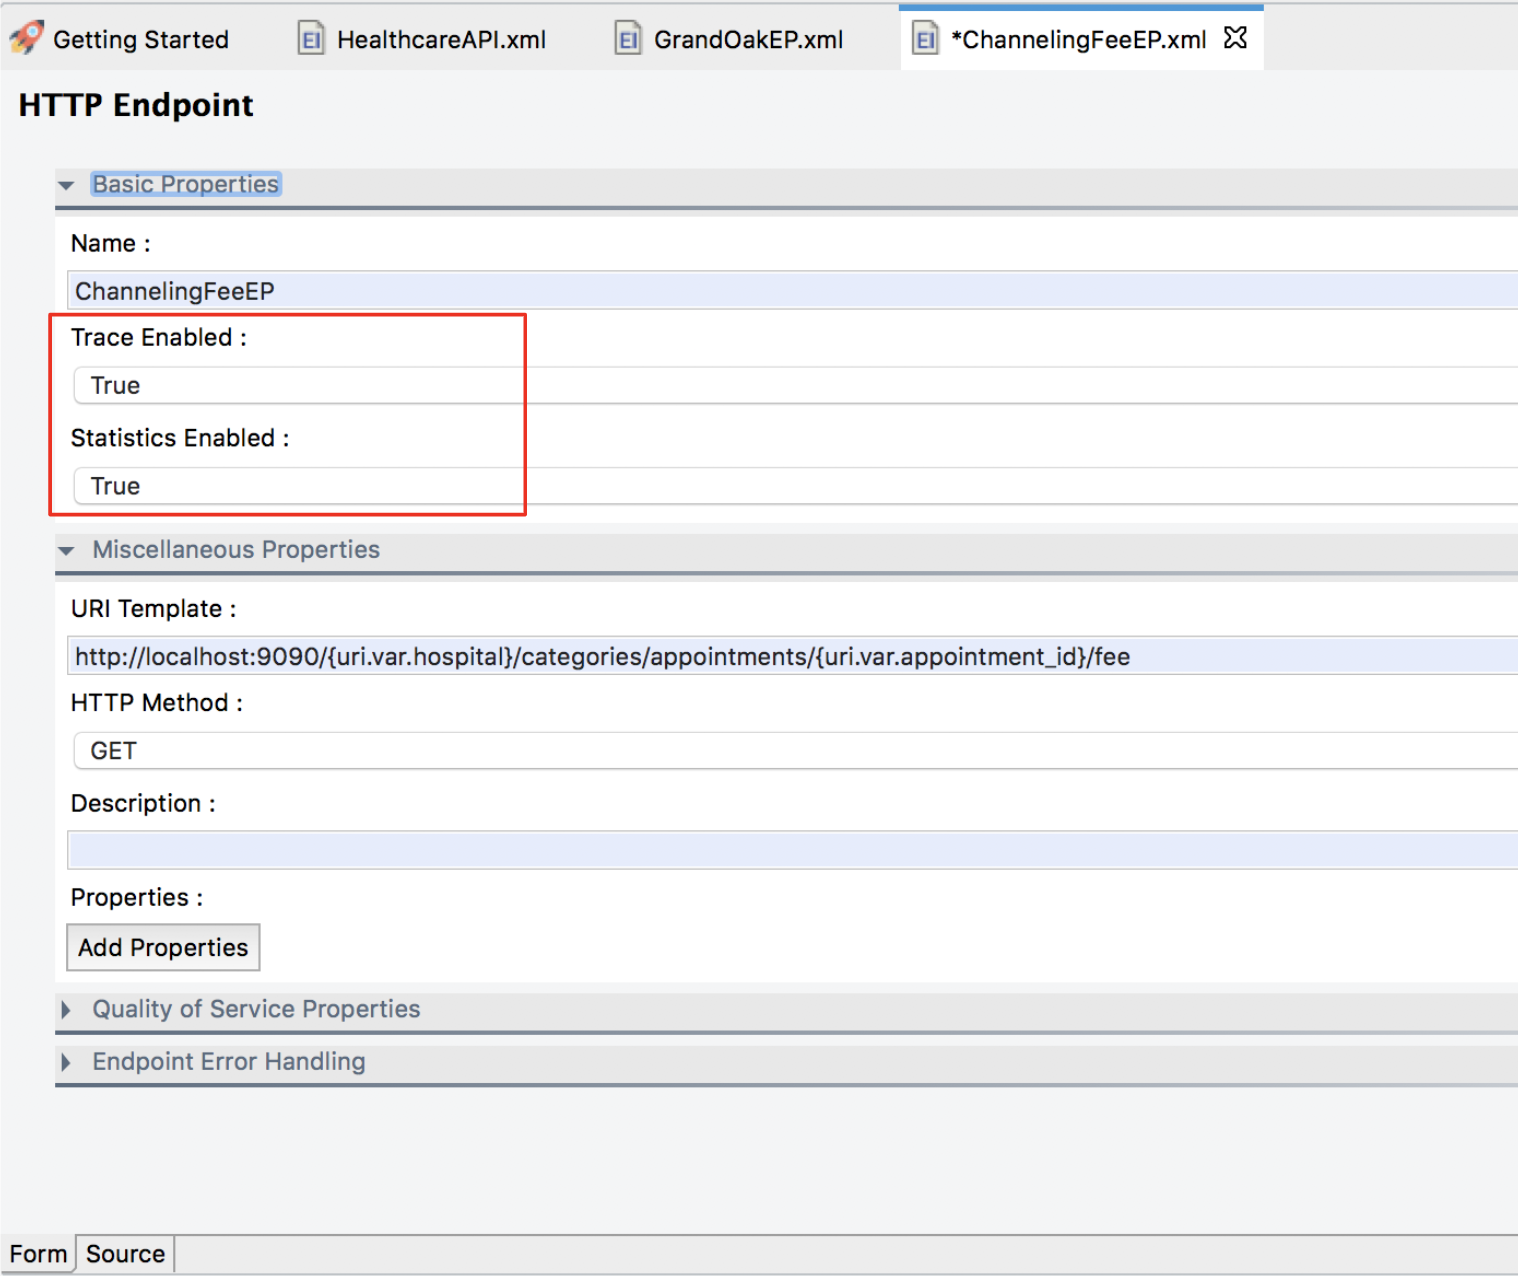
Follow the steps below to enable statistics for the endpoint artifacts:
- Select the required endpoint artifacts from the project explorer.
- Select Statistics Enabled and (if required) Trace Enabled as shown below.
Starting the Analytics Worker
Note
Be sure to start the Analytics worker before starting the Micro Integrator.
- Download and install WSO2 Enterprise Integrator 6.x.x. The location of your WSO2 EI 6.x.x installation will be referred to as
<EI_6.x.x_HOME>from hereon. - Open a terminal and navigate to the
<EI_6.x.x_HOME>/wso2/analytics/bindirectory. -
Start the Analytics Worker runtime by executing the following command:
-
On MacOS/Linux/CentOS
sh worker.sh -
On Windows
worker.bat
-
Load balancing among multiple Analytics servers
You can send events to multiple Analytics servers either by sending the same event to many Analytics servers or by load balancing events among a set of servers. This handles the failover problem. When events are load balanced within a set of servers and if one receiver cannot be reached, events are automatically sent to the other available and active Analytics servers. The following scenarios are covered in this section.
Load balancing across a group of servers
To configure this setup, configure the Analytics receiver URL specified in the Micro Integrator as a comma-separated list of Analytics servers.
The format of the receiver URL should be as follows: tcp://<Analytics-1>:<port>,tcp://<Analytics-2>:<port>,tcp://<Analytics-3>:<port>
Example configuration in the deployment.toml file of the Micro Integrator:
[monitoring]
ei_analytics.server_url = "tcp://10.100.2.32:7611, tcp://10.100.2.33:7611, tcp://10.100.2.34:7611"
ei_analytics.auth_server_url = "tcp://10.100.2.32:7612, tcp://10.100.2.33:7612, tcp://10.100.2.34:7612"
ei_analytics.username = "admin"
ei_analytics.password = "admin" 
This handles failover as follows: If Analytics Receiver-1 is marked as down, then the Micro Integrator will send the data only to Analytics Receiver-2 and Analytics Receiver-3 in a round robin manner. When the Analytics Receiver-1 becomes active after some time, the Micro Integrator automatically detects it, adds it to the operation, and again starts to load balance between all three receivers. This functionality significantly reduces the loss of data and provides more concurrency.
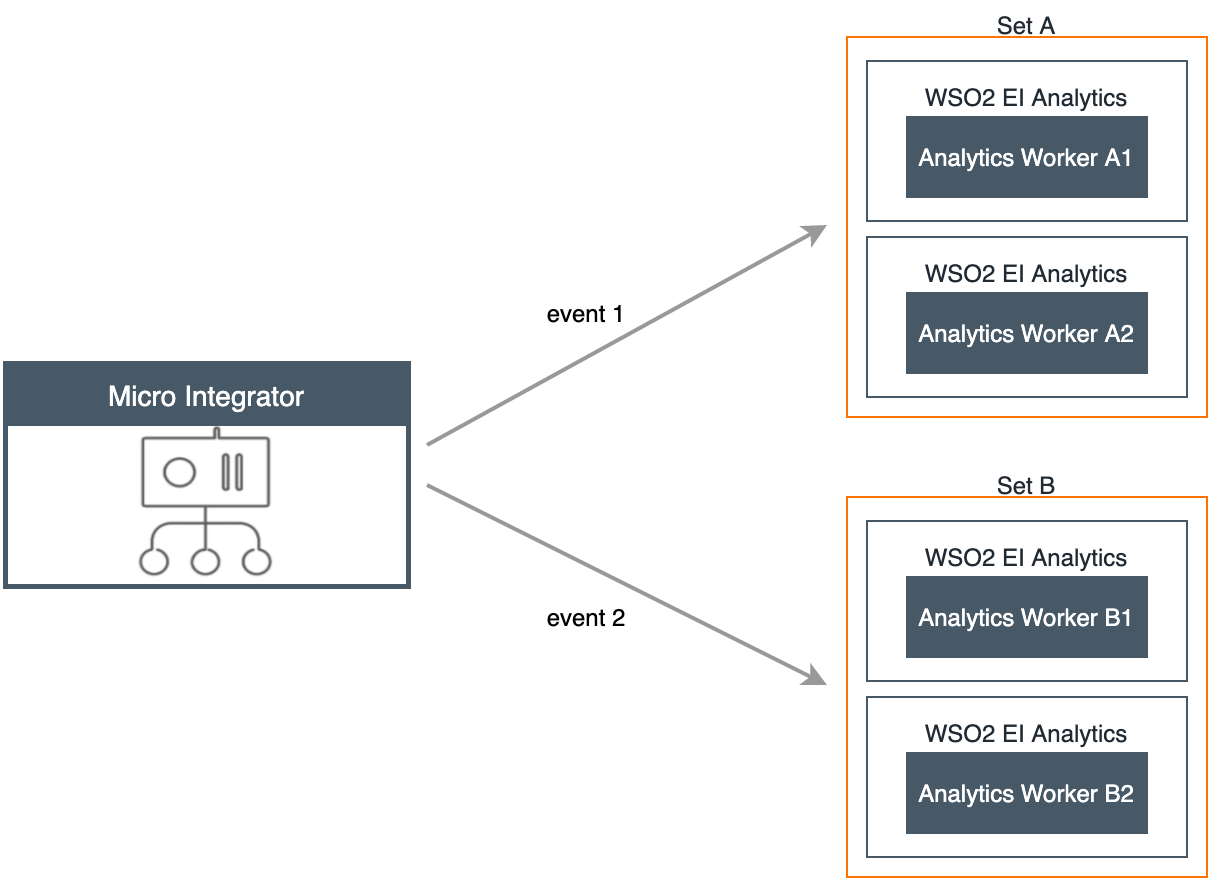
Load balancing across multiple groups of servers
In this setup, there are two sets of servers that are referred to as set-A and set-B.
You can send events to both the sets. You can also carry out load balancing for both sets as mentioned in Load balancing across a group of servers.
This scenario is a combination of load balancing between a set of servers and sending an event to several receivers.
An event is sent to both set-A and set-B. Within set-A, it will be sent either to Analytics A1 or Analytics A2.
Similarly within set-B, it will be sent either to Analytics B1 or Analytics B2.
In the setup, you can have any number of sets and any number of servers as required.
Similar to the other scenarios, you need to describe the server URLs as the receiver URL in the Micro Integrator configuration. The sets should be specified within curly braces separated by commas. Furthermore, each receiver that belongs to the set should be within the curly braces and with the receiver URLs in a comma-separated format.
The format of the receiver URL should be as follows: {tcp://Analytics-A1:port, tcp://Analytics-A2:port},{tcp://Analytics-B1:port, tcp://Analytics-B2:port}
Example configuration in the deployment.toml file of the Micro Integrator:
[monitoring]
ei_analytics.server_url = "{tcp://10.100.2.32:7611, tcp://10.100.2.33:7611}, {tcp://10.100.2.34:7611, tcp://10.100.2.35:7611}"
ei_analytics.auth_server_url = "{tcp://10.100.2.32:7612, tcp://10.100.2.33:7612}, {tcp://10.100.2.34:7612, tcp://10.100.2.35:7612}"
ei_analytics.username = "admin"
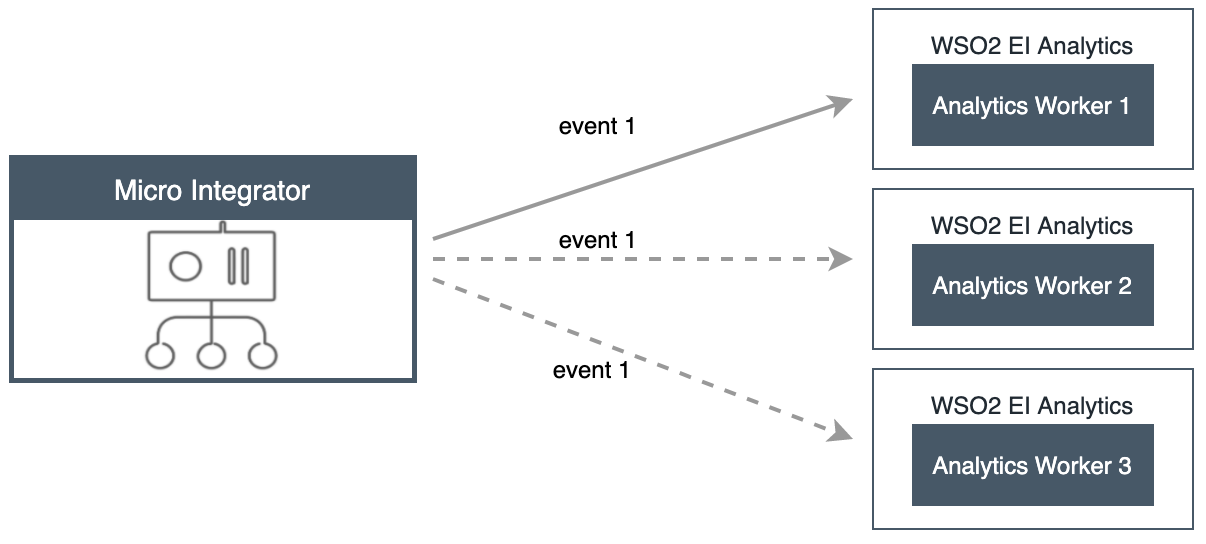
ei_analytics.password = "admin" Sending all events to several analytics servers
This setup involves sending all the events to more than one Analytics server.
This approach is useful when you want to have multiple Analytics servers to analyze the same events simultaneously.
For example, as shown below, you can configure the Micro Integrator to publish the same event to both Analytics servers at the same time.

The Analytics receiver URL should be configured with the following format in the Micro Integrator: {tcp://Analytics-1>:<port>}, {tcp://Analytics-2>:<port>}, {tcp://<Analytics-3>:<port>}
Example configuration in the deployment.toml file of the Micro Integrator:
[monitoring]
ei_analytics.server_url = "{tcp://10.100.2.32:7611},{ tcp://10.100.2.33:7611}, {tcp://10.100.2.34:7611}"
ei_analytics.auth_server_url = "{tcp://10.100.2.32:7612},{ tcp://10.100.2.33:7612}, {tcp://10.100.2.34:7612}"
ei_analytics.username = "admin"
ei_analytics.password = "admin"
Failover configuration
When using the failover configuration in publishing events to Analytics, events are sent to multiple Analytics servers in a sequential order based on priority.
You can specify multiple Analytics servers so that events can be sent to the next server in the sequence in a situation where they were not successfully sent to the first server.
In the scenario depicted in the above image, the events are first sent to Analytics-1.
If it is unavailable, then events will be sent to Analytics-2.
If Analytics-2 is also unavailable, then the events will be sent to Analytics-3.
The Analytics receiver URL should be configured with the following format in the Micro Integrator: tcp://<Analytics-1>:<port>|tcp://<Analytics-2>:<port>|tcp://<Analytics-3>:<port>
[monitoring]
ei_analytics.server_url = "tcp://10.100.2.32:7611|tcp://10.100.2.33:7611|tcp://10.100.2.34:7611"
ei_analytics.auth_server_url = "tcp://10.100.2.32:7612|tcp://10.100.2.33:7612|tcp://10.100.2.34:7612"
ei_analytics.username = "admin"
ei_analytics.password = "admin"
Starting the Micro Integrator
Warning
To allow the Micro Integrator server and the Analytics server to communicate using SSL, the digital certificates should be shared by the two servers. See the instructions on adding SSL certificates to keystores.
For testing, you can simply copy the keystore files from the <EI_6.x.x_HOME>/wso2/analytics/resources/security directory to the MI_HOME/resources/security directory.
Once you have started the Analytics Worker, you can start the Micro Integrator with your integration artifacts.
Starting the Analytics Dashboard
- Open a terminal and navigate to the
<EI_6.x.x_HOME>/wso2/analytics/bindirectory. -
Start the Analytics Dashboard runtime by executing the following command:
-
On MacOS/Linux/CentOS
sh dashboard.sh -
On Windows
dashboard.bat
-
In a new browser window or tab, open the Analytics dashboard using the following URL: https://localhost:9643/portal . Use
admin for both the username and password.
Now, you can invoke the integration artifacts and view the statistics on this dashboard.
Invoking the artifacts
Starting the backend
Let's start the hospital service that serves as the backend to the service chaining use case:
- Download the JAR file of the back-end service from here.
- Open a terminal, navigate to the location where your saved the back-end service.
-
Execute the following command to start the service:
java -jar Hospital-Service-2.0.0-EI7.jar
Sending a message
Let's send 8 requests to the Micro Integrator to invoke the integration artifacts:
Tip
For the purpose of demonstrating how successful messages and message failures are illustrated in the dashboard, let's send 2 of the requests while the back-end service is not running. This should generate a success rate of 75%.
-
Create a JSON file called
request.jsonwith the following request payload.{ "name": "John Doe", "dob": "1940-03-19", "ssn": "234-23-525", "address": "California", "phone": "8770586755", "email": "[email protected]", "doctor": "thomas collins", "hospital": "grand oak community hospital", "cardNo": "7844481124110331", "appointment_date": "2025-04-02" } -
Open a command line terminal and execute the following command (six times ) from the location where you save the
request.jsonfile:curl -v -X POST --data @request.json http://localhost:8290/healthcare/categories/surgery/reserve --header "Content-Type:application/json"If the messages are sent successfully, you will receive the following response for each request.
{"appointmentNo":1, "doctorName":"thomas collins", "patient":"John Doe", "actualFee":7000.0, "discount":20, "discounted":5600.0, "paymentID":"e1a72a33-31f2-46dc-ae7d-a14a486efc00", "status":"Settled"} -
Now, shut down the back-end service and send two more requests.
Analyzing statistics
Go to the Analytics Dashboard and see the statistics listed below.
Tip
See the documentation on using the Analytics dashsboard for more information on dashboard function.
-
Click the Enterprise Integrator Analytics icon shown below to open the dashboard.

-
View the statistics overview for all the integration artifacts that have published statistics:

-
The number of transactions handled by the Micro Integrator per second is mapped on a graph as follows.

-
The success rate and the failure rate of the messages received by the Micro Integrator during the last hour are mapped in a graph as follows.

-
The
HealthcareAPIREST API is displayed under TOP APIS BY REQUEST COUNT as follows.

- The three endpoints used for the message mediation are displayed
under Top Endpoints by Request Count as shown below.

- In the Top APIS BY Request COUNT gadget, click
HealthcareAPIto open the OVERVIEW/API/HealthcareAPI page. The following is displayed.- The API Request Count gadget shows the total number of
requests handled by the
StockQuoteAPIREST API during the last hour:

- The API Message Count gadget maps the number of
successful messages as well as failed messages at different
times within the last hour in a graph as shown below.

- The API Message Latency gadget shows the speed with
which the messages are processed by mapping the amount of time
taken per message at different times within the last hour as
shown below.

- The Messages gadget lists all the the messages handled by
the
StockQuoteAPIREST API during the last hour with the following property details as follows.

- The Message Flow gadget illustrates the order in which the
messages handled by the
StockQuoteAPIREST API within the last hour passed through all the mediation sequences, mediators and endpoints that were included in the message flow as shown below.

- The API Request Count gadget shows the total number of
requests handled by the
-
In the Top Endpoints by Request Count gadget, click one of the endpoints to view simillar statistics per endpoint.
ChannelingFeeEPSettlePaymentEPGrandOaksEP
-
You can also navigate to any of the artifacts by using the top-left menu as shown below. For example, to view the statistics of a specific endpoint, click Endpoint and search for the required endpoint.

Message tracing
When you go to the Analytics Dashboard the message details will be logged as follows:
