Step 7: Monitor Statistics
This step shows how you can monitor the CDC and file statistics of the WSO2 Streaming Integrator deployment you started and the SweetFactoryApp Siddhi application you created and deployed in the previous steps. For this purpose, you are using the some of the pre-configured dashboards provided by WSO2 Streaming Integrator. You can host these dashboards in Grafana and view statistices related to ETL activities carried out by the Streaming Integrator.For more information about these dashboards, see Monitoring ETL Statistics with Grafana
Configuring WSO2 SI to visualize statistics
To be able to see visualizations of statistics generated by WSO2 Streaming Integrator, you are required to download and install Prometheus and Grafana. You need to download the required pre-configured dashboards and import them to Grafana.
Downloading the required dashboards
WSO2 Streaming Integrator provides you with pre-configured dashboards in JSON format. You can import these dashboards bto Grafana to view statistics of your Streaming Integrator deployment.
For this scenario, download the following dashboards:
Downloading and setting up Prometheus
WSO2 Streaming Integrator uses Perometheus to expose its statistics to Grafana. Therefore, to download and configure Prometheus, follow the steps below:
-
Download Prometheus from the Prometheus site. For instructions, see the Prometheus Getting Started Guide.
-
Extract the downloaded file. The directory that opens as a result is referred to as the
<PROMETHEUS_HOME>from here on. -
To enable statistics for the Prometheus reporter, open the
<SI_HOME>/conf/server/deployment.yamlfile and set theenabledparameter in thewso2.metricssection totrue, and update the other parameters in the section as shown below. You also need to add themetrics.prometheus:as shown.wso2.metrics: # Enable Metrics enabled: true reporting: console: - # The name for the Console Reporter name: Console # Enable Console Reporter enabled: false # Polling Period in seconds. # This is the period for polling metrics from the metric registry and printing in the console pollingPeriod: 2 metrics.prometheus: reporting: prometheus: - name: prometheus enabled: true serverURL: "http://localhost:9005" -
Open the
<PROMETHEUS_HOME>/prometheus.ymlfile and add the following configuration in thescrape_configs:section.scrape_configs: - job_name: 'prometheus' static_configs: - targets: ['localhost:9005'] -
In the terminal, navigate to the
<PROMETHEUS_HOMEand issue the following command to start the Prometheus server../prometheus
Info
The above steps to configure and start Prometheus need to be performed before you start the Grafana server.
Control the growth of the WSO2_METRICS_DB
After enabling metrics.prometheus you might notice the growth of the WSO2_METRICS_DB. Below are the 2 options
that can be followed to overcome this issue.
Option 1
- Open the
<SI_HOME>/conf/server/deployment.yamlfile. - Set the
Enable JDBC Reporterparameter to false. Note that after you disable this, only the real-time metrics are displayed and information relating to metrics history is not displayed.# Enable JDBC Reporter enabled: false - Restart the SI component to apply the changes.
Option 2
- Open the
<SI_HOME>/conf/server/deployment.yamlfile. - Enable scheduled cleanup of the database under the
wso2.metrics.jdbcparameter.wso2.metrics.jdbc: # Data Source Configurations for JDBC Reporters dataSource: - &JDBC01 dataSourceName: java:comp/env/jdbc/WSO2MetricsDB # Schedule regular deletion of metrics data older than a set number of days. # It is recommended that you enable this job to ensure your metrics tables do not get extremely large. # Deleting data older than seven days should be sufficient. scheduledCleanup: # Enable scheduled cleanup to delete Metrics data in the database. enabled: true # The scheduled job will cleanup all data older than the specified days daysToKeep: 3 # This is the period for each cleanup operation in seconds. scheduledCleanupPeriod: 86400
Downloading and setting up Grafana
The pre-configured dashboards provided by WSO2 Streaming Integrator which you previously downloaded are rendered in Grafana to visualize statistics. To download and set up Grafana, follow the steps below:
Before you begin:
Start the Prometheus server as instructed under Downloading and setting up Prometheus.
-
Download Grafana from the Grafana Labs - Download Grafana.
-
Start Grafana.
Info
The procedure to start Grafana depends on your operating system and the installation process. e.g., If your operating system is Mac OS and you have installed Grafana via Homebrew, you start Grafana by issuing the
brew services start grafanacommand. -
In the Data Sources section, click Add your first data source. In the Add data source page that appears, click Select for Prometheus.
-
In the Add data source page -> Settings tab, update the configurations for Prometheus as follows.
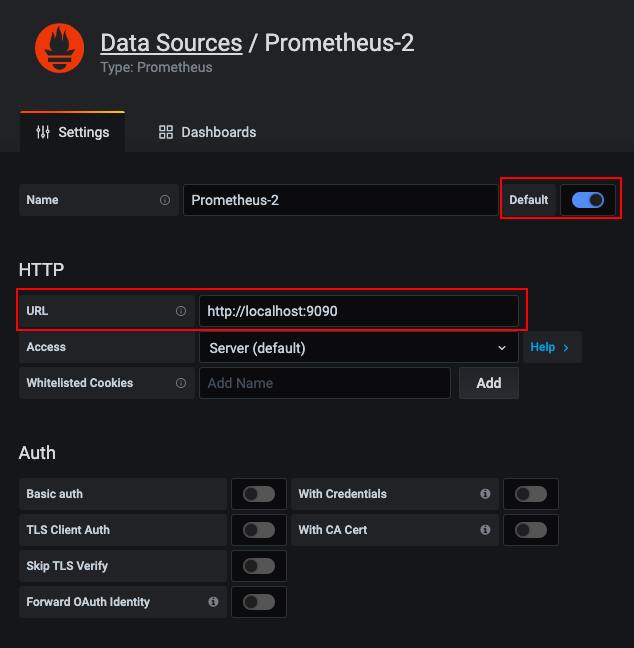
-
Click Default to make Prometheus the default data source.
-
Under HTTP, enter
http://localhost:9090as the URL. -
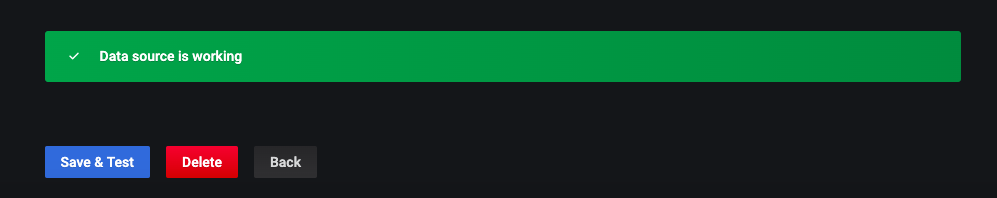
Click Save & Test. If the data source is successfully configured, it is indicated via a message.
-
To import the dashboards that you previously downloaded as JSON files, follow the procedure below:
-
Start Grafana and access it via http://localhost:3000/.
-
To load a new dashboard, click the plus icon (+) in the side panel. Then click Import.
-
In the Import page, click Upload .json file. Then browse and select the .json file of the preconfigured dashboard that you downloaded (i.e., in step 5, substep 1).
-
If required, change the unique identifier displayed in the Unique Identifier (uid).
-
Click Import.
-
Enable the Siddhi application to publish statistics
To enable the SweetFactoryApp Siddhi application to publish statistics to Prometheus, add the @App:statistics(reporter = 'prometheus') annotation to it below the @App:name annotation as shown below:
Tip
You can update the Siddhi application in Streaming Integrator Tooling and deploy it again in the Streaming Integrator server as you did in Step 5: Update the Siddhi Application.
Viewing statistics
To generate some statistics and view them, follow the procedure below.
-
Start WSO2 Streaming Integrator.
-
To generate statistics, insert as many events as you want into the
SweetProductionTableMySQL table that you created for this scenario in Step 1: Download Streaming Integrator and Dependencies. Also, manually add as many rows as you want in the/Users/foo/productioninserts.csvfile. -
Access Grafana via the
localhost:3000URL. -
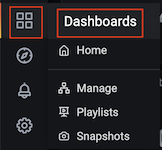
In the side panel, click the Dashboards icon and click Dashboards.
Then click on the WSO2 Streaming Integrator - Overall Statistics dashboard. It opens as follows.
Info
The statistics displayed will be different based on the number of records you inserted to the
SweetProductionTableMySQL table and the number of rows you added in the/Users/foo/productioninserts.csvfile during the last 30 minutes. You can also change the time interval for which statistics are displayed via the field for selecting the time interval in the top panel.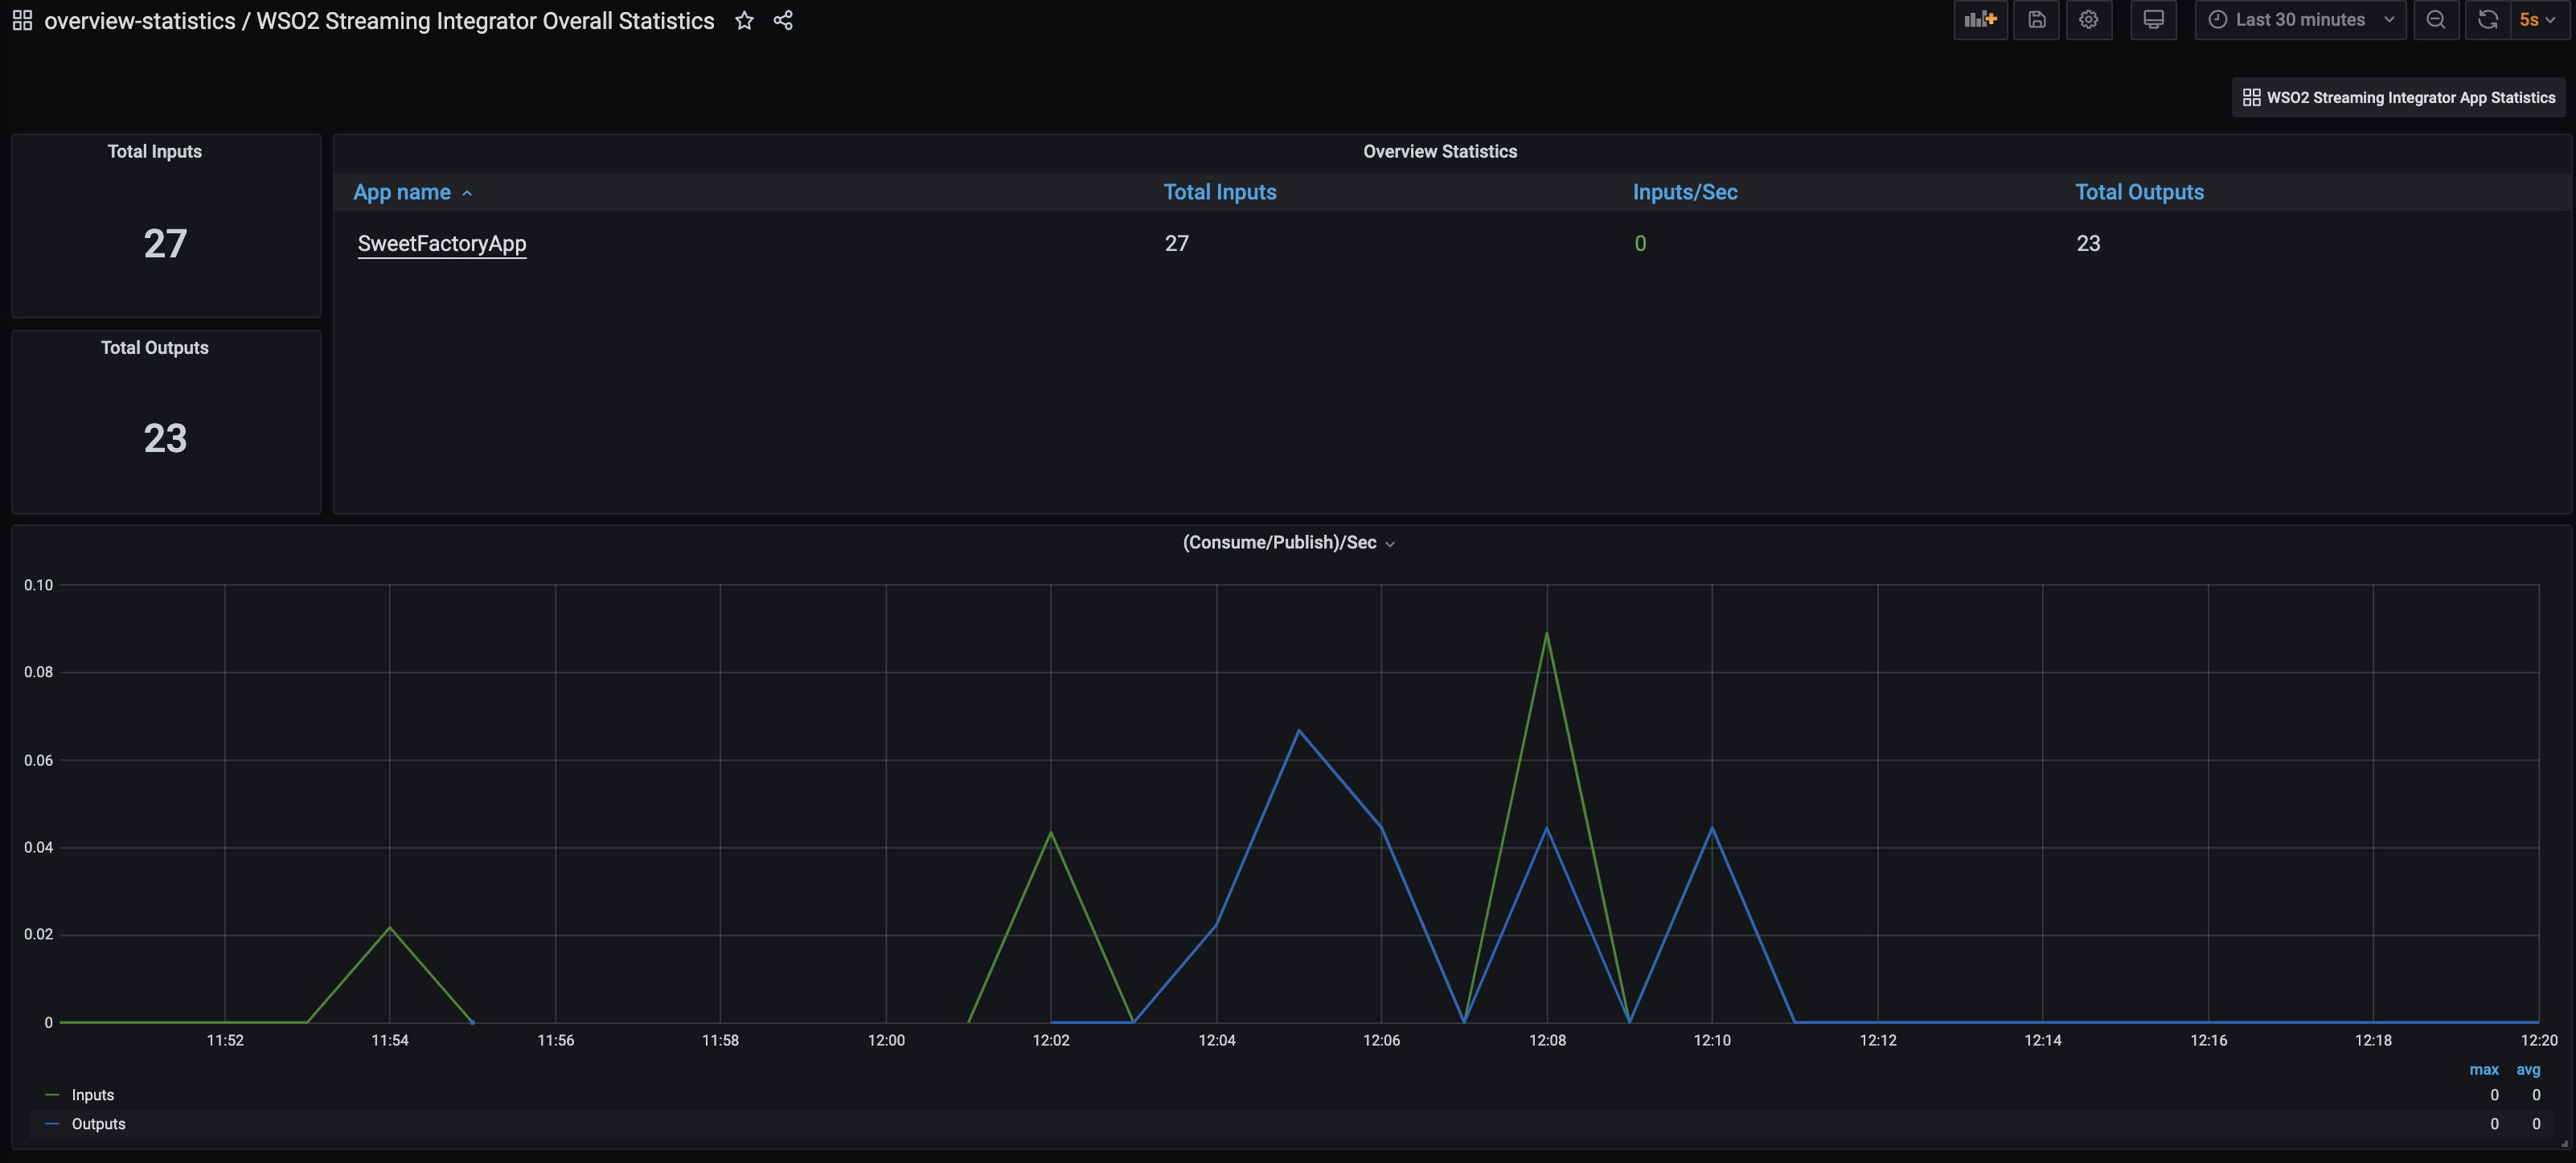
-
Under Overview Statistics, click SweetFactoryApp. The overview-statistics / WSO2 Streaming Integrator App Statistics dashboard opens.

-
Scroll down to the Sources section. The following is displayed.
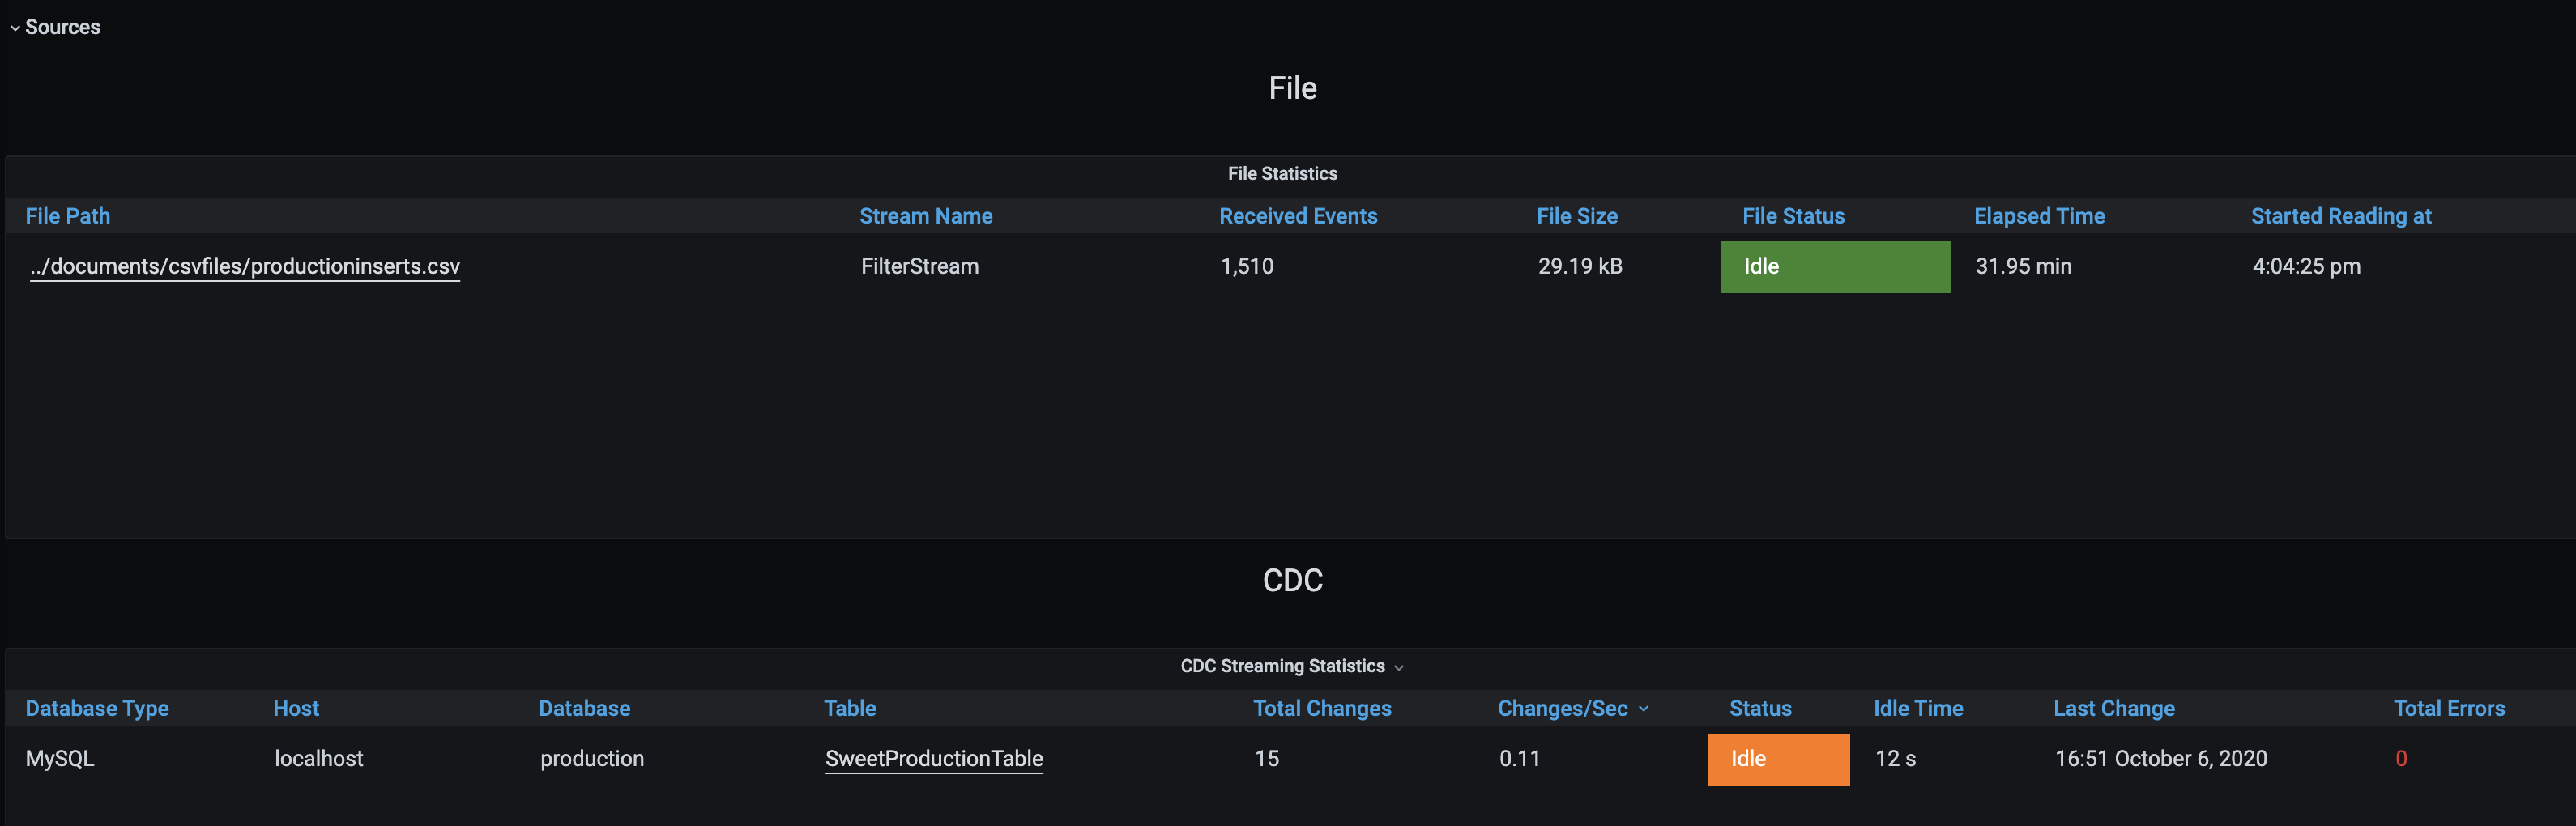
The two entries displayed above represent the
filesource and thecdcsource used in theSweetFactoryAppSiddhi application. -
Scroll down further to the Destinations section. The
filesink in theSweetFactoryAppSiddhi application is displayed as shown below.
-
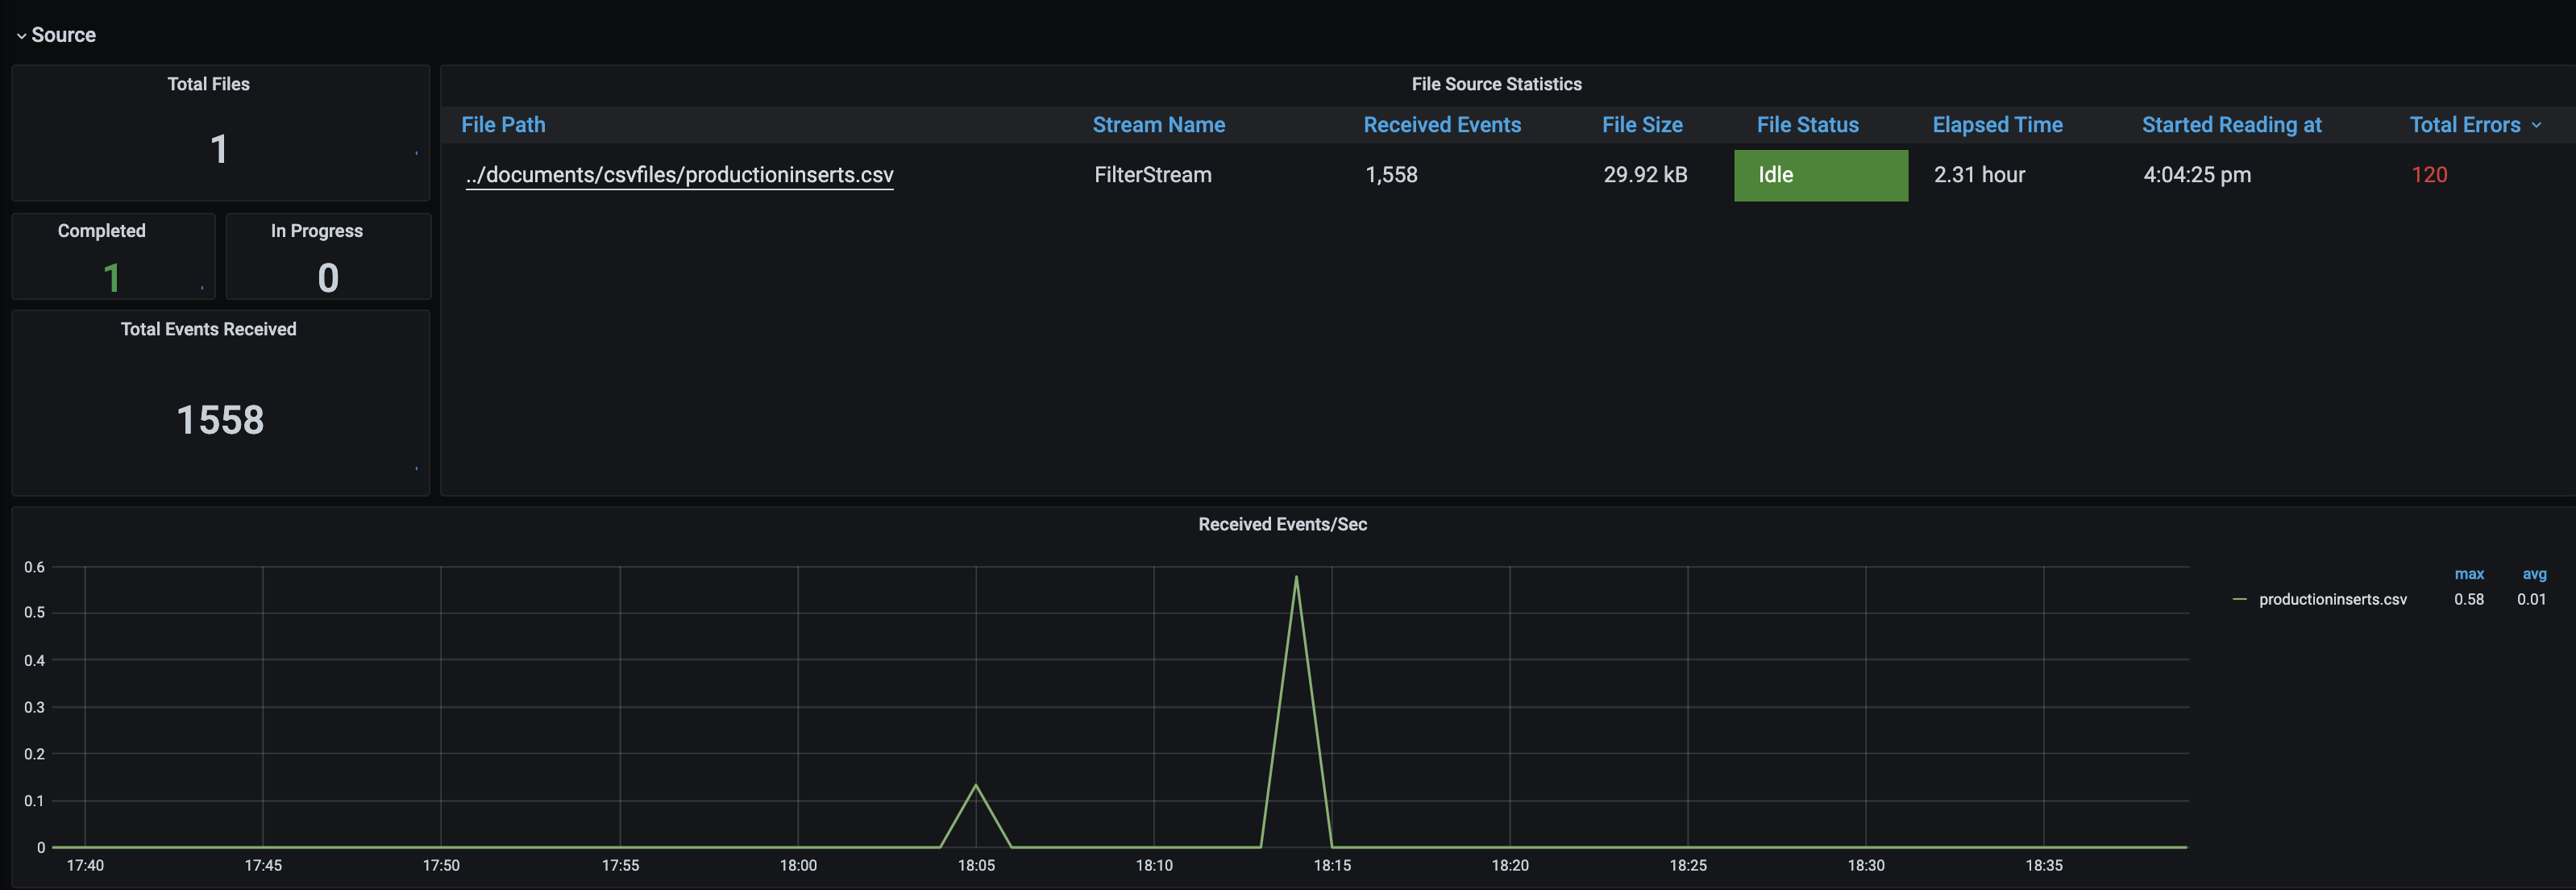
Under Sources, click on the link to the
productioninserts.csvfile. The WSO2 Streaming Integrator - File Statistics dashboard opens. The contents of theproductioninserts.csvfile is the output of one query and the input of another. Therefore, it is a source as well as a destination, statistics are displayed for it under Source and Sink as shown below.Source Statistics
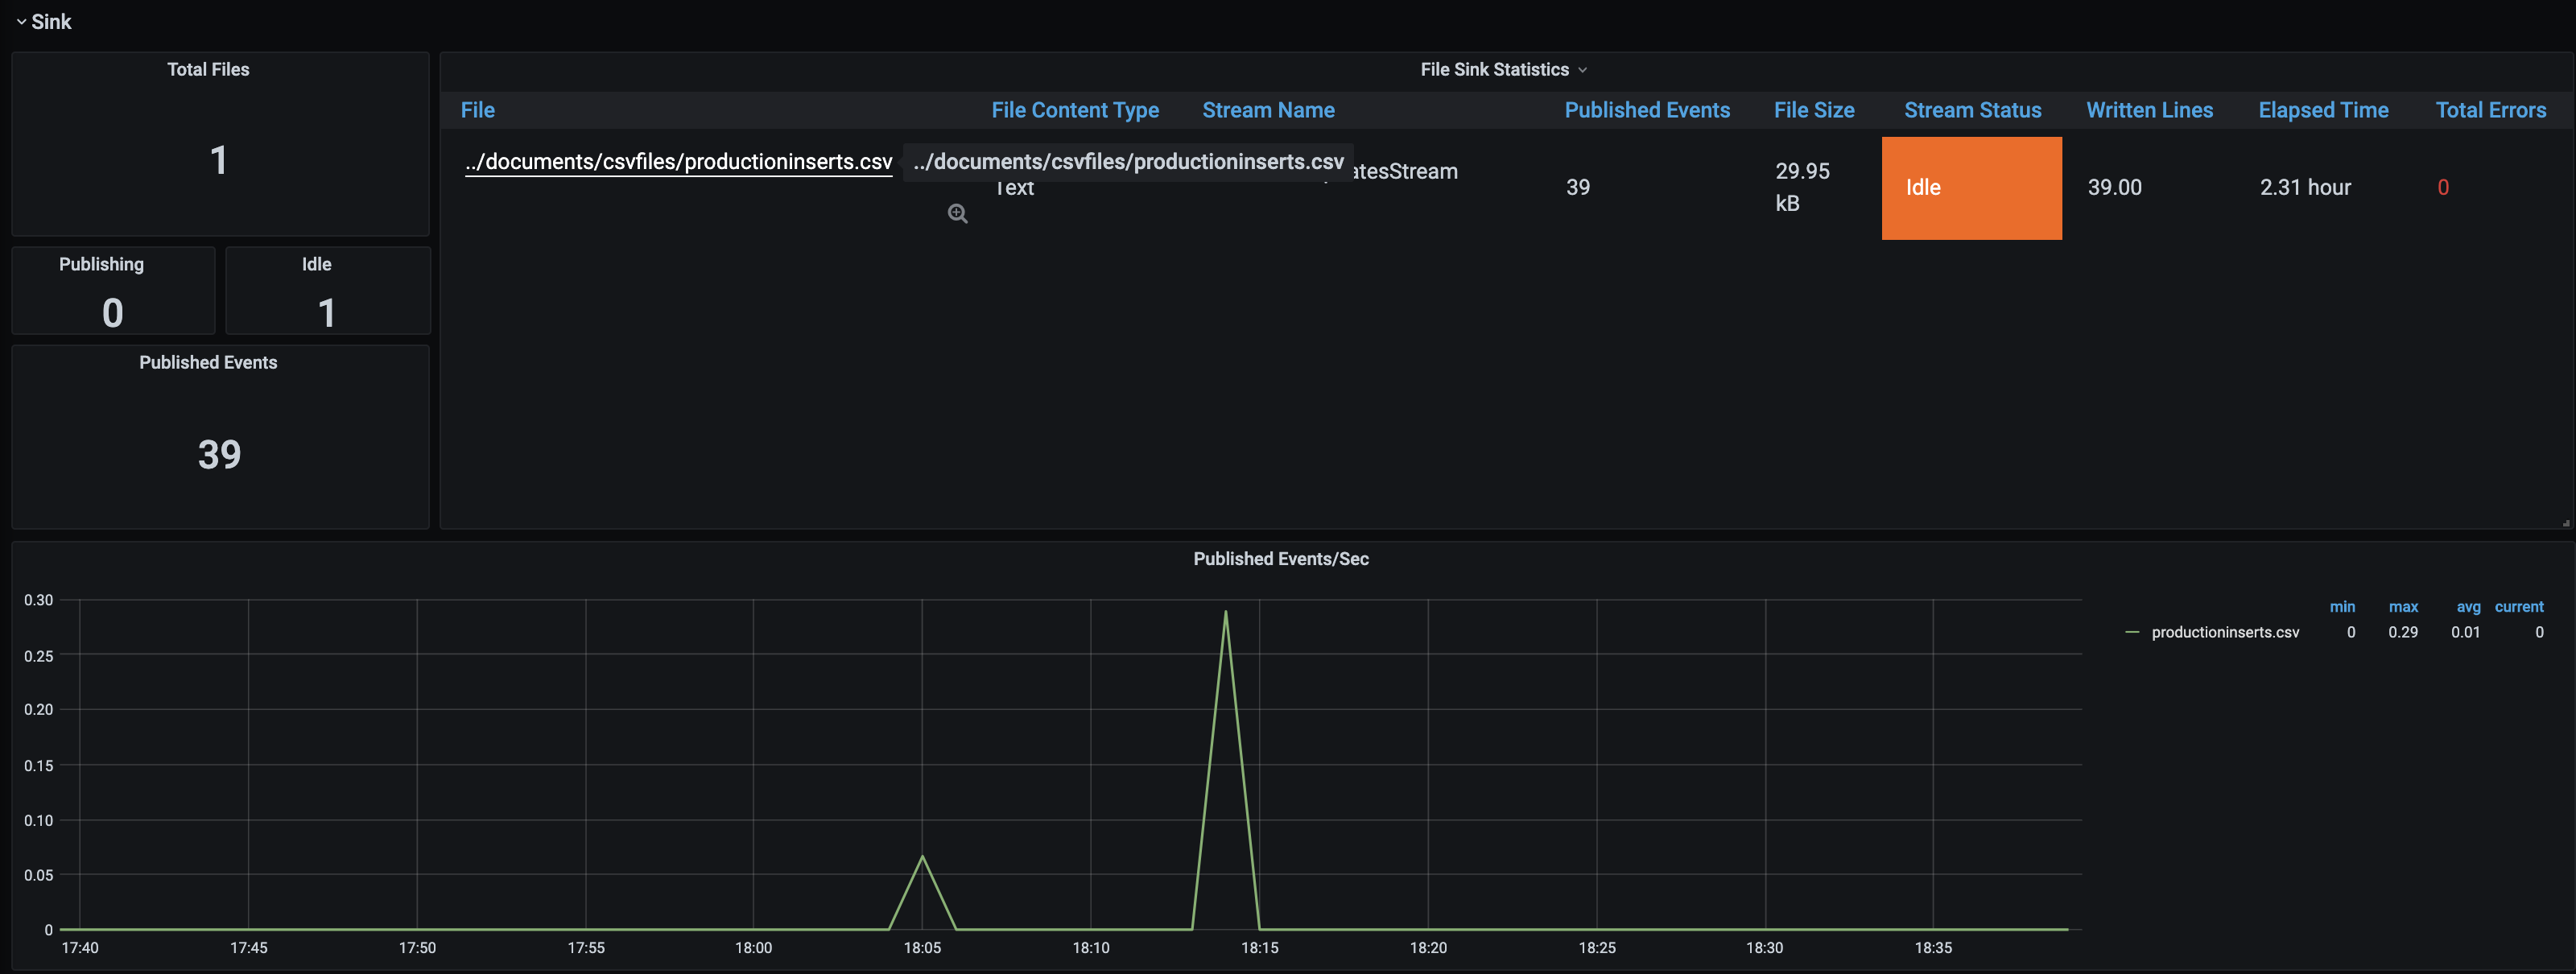
Sink Statistics
-
Under WSO2 Streaming Integrator - File Statistics dashboard -> Sources, click on the file link. The file-statistics / WSO2 Streaming Integrator / File Source Statistics dashboard opens displaying detailed statistics for the file when it is functioning as a source.
-
Under WSO2 Streaming Integrator - File Statistics dashboard -> Sources, click on the file link. The file-statistics / WSO2 Streaming Integrator / File Sink Statistics dashboard opens displaying detailed statistics for the file when it is functioning as a source.
-
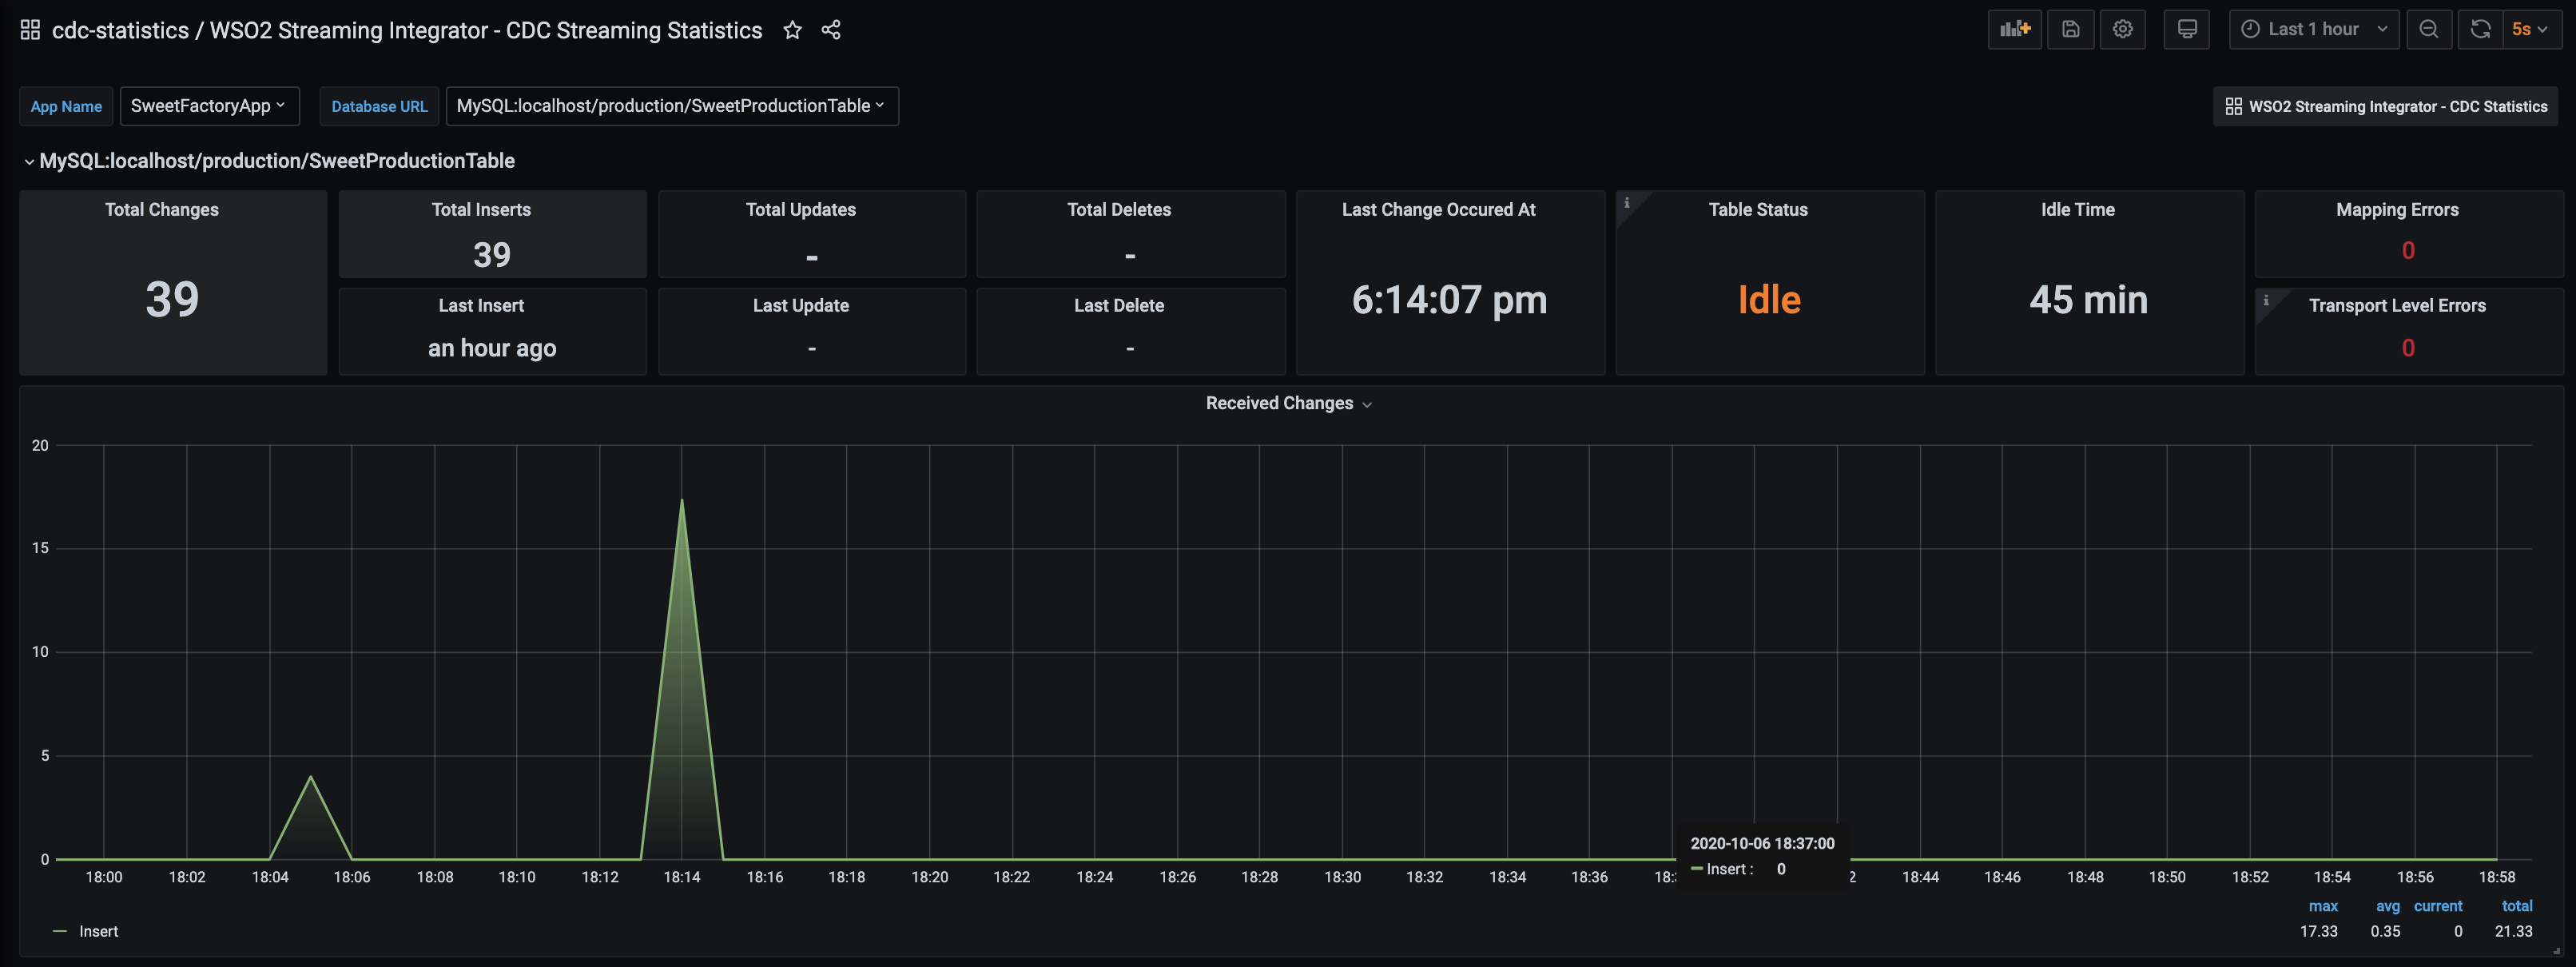
In the overview-statistics / WSO2 Streaming Integrator App Statistics dashboard -> CDC section, click on the SweetProductionTable link. The cdc-statistics / WSO2 Streaming Integrator / CDC Statistics dashboard opens with statistics generated for the
cdcsource in theSweetFactoryAppSiddhi application.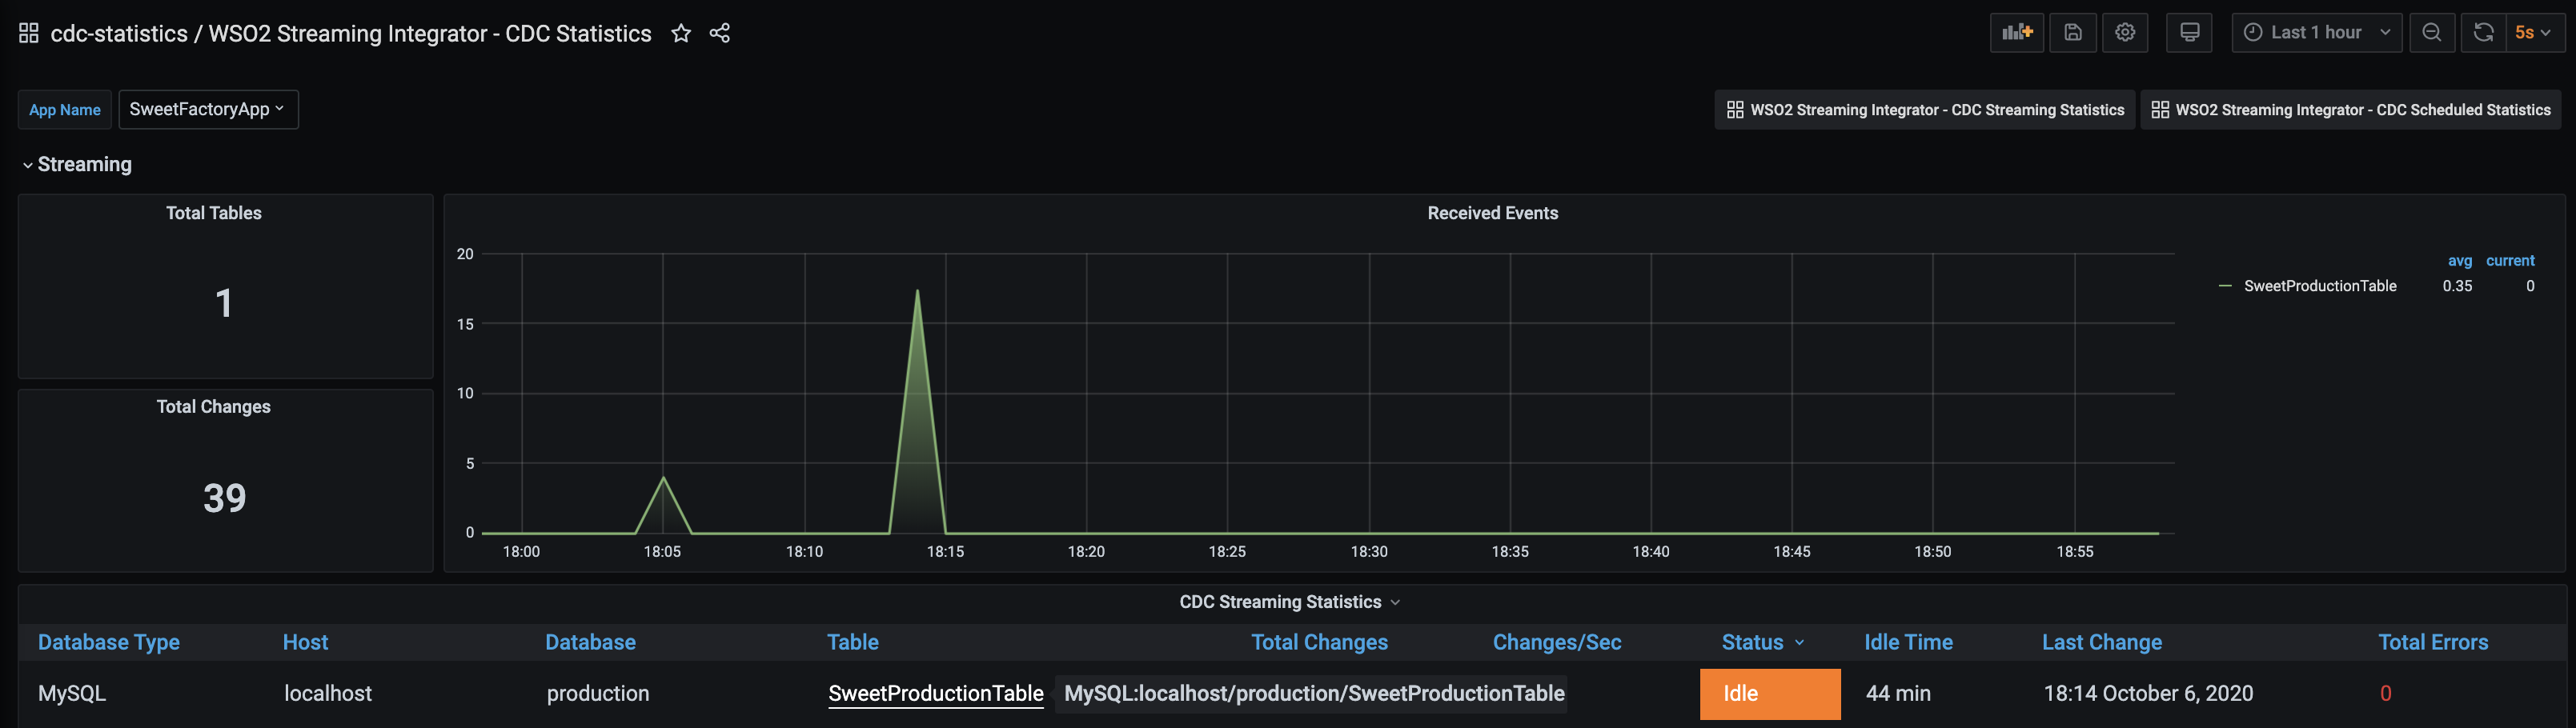
Under Streaming, click on the SweetProductionTable link. The cdc-statistics / WSO2 Streaming Integrator / CDC Streaming Statistics dashboard opens as follows.
What's Next?
- To learn more about the key concepts of WSO2 Streaming Integrator, see Key Concepts.
- For more hands-on experience with WSO2 Streaming Integrator, try the Tutorials.
- For more guidance as you use WSO2 Streaming Integrator for your Streaming Integration use cases, see Use Cases.
- Learn how to run WSO2 Streaming Integrator in containerized environments, try Running SI with Docker and Kubernetes