Managing Dashboards
WSO2 Streaming Integrator uses Grafana to host and view its pre-configured dashboards that are designed to view statistics relating to its performance as well as streaming activities. The pre-configured dashboards are imported to Grafana as JSON files. Once they are imported, you can organize them in folders, view them, and/or delete them.
Importing dashboards
To import dashboards, follow the procedure below:
-
Download the required JSON file (i.e., based on the statistics you need to view) from here.
-
Start Grafana and access it via
http://localhost:3000/. -
To load a new dashboard, click the plus icon (+) in the side panel. Then click Import.
-
In the Import page, click Upload .json file. Then browse and select the .json file of the preconfigured dashboard that you downloaded (i.e., in step 5, substep 1).
-
If required, change the unique identifier displayed in the Unique Identifier (uid).
-
Click Import.
Organizing dashboards in folders
!!! Before you begin: Download the related JSON file(s) of one or more dashboards from here, and import them to Grafana. For instructions, see Importing dashboards.
The dashboards you import are saved in the General folder by default. If required, you can create a design a folder structure that matches your requirement and save the dashboards in the different folders of the structure based on your categorization of the dashboards.
Creating new folders
To create a new folder, follow the procedure below:
-
Start and access Grafana via
http://localhost:3000/. -
In the left pane, click the Dashboards icon, and then click Manage.
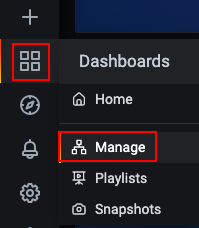
This opens the Dashboards/Manage tab.
-
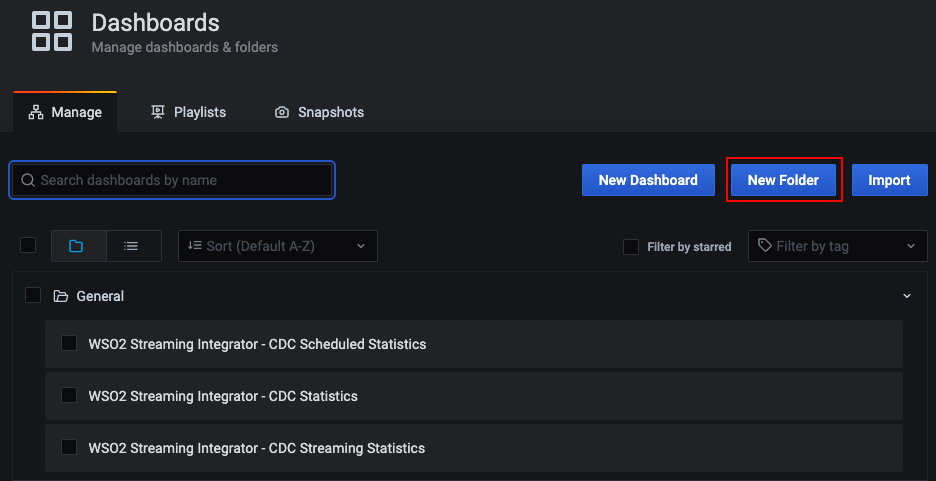
Click New Folder. In the Folder Name field that appears, enter a name (e.g.,
cdc-statistics) for the new folder that you are creating. Then click Create. -
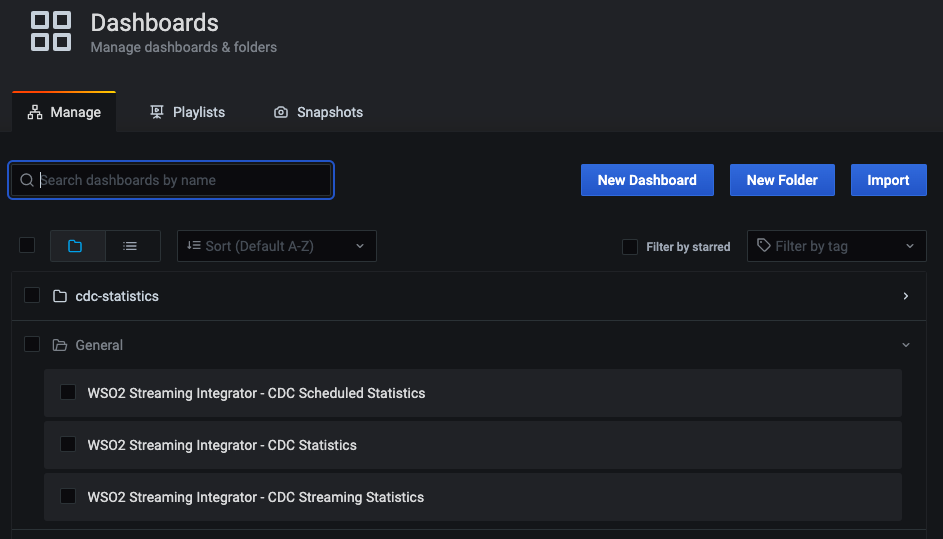
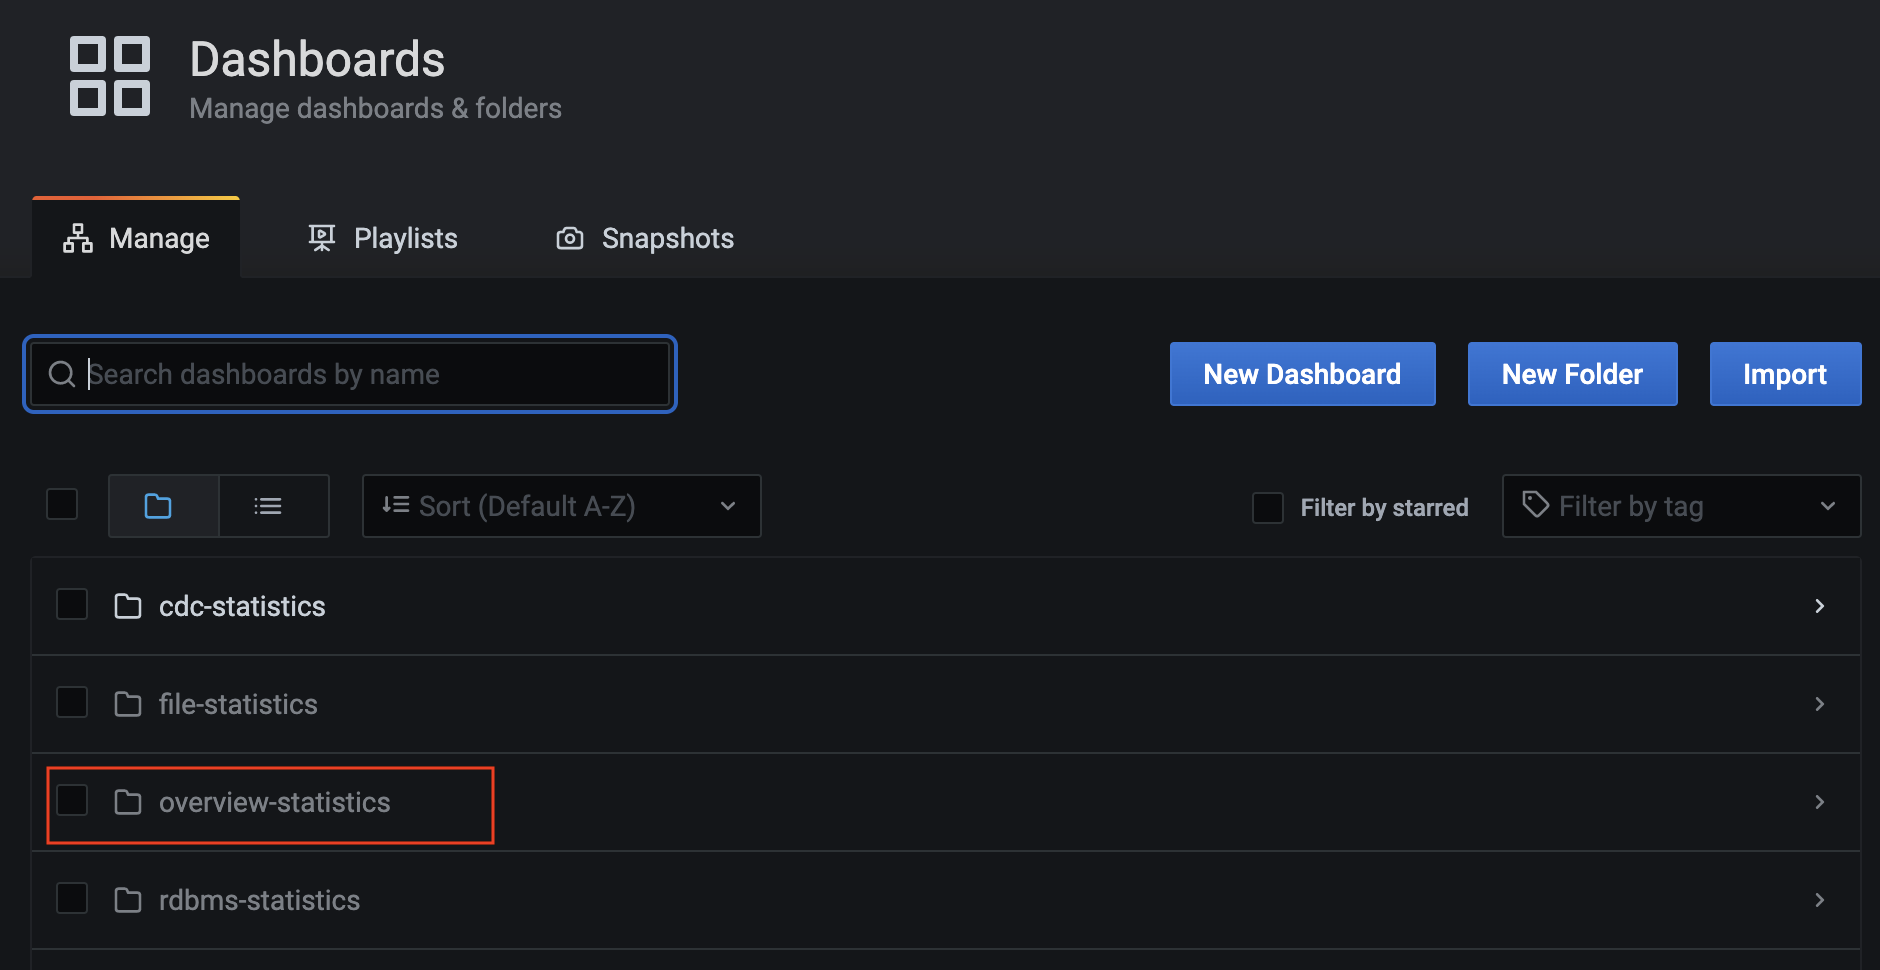
Navigate back to the Dashboards/Manage tab. You can do this by clicking Manage Dashboards in the message that appears in the page of your new folder.
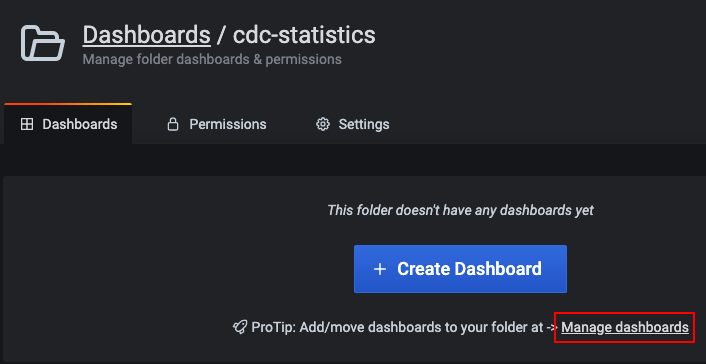
The new folder you created appears as shown in the following image.
Moving dashboards between folders
To move selected dashboards to a specific folder, follow the procedure below:
-
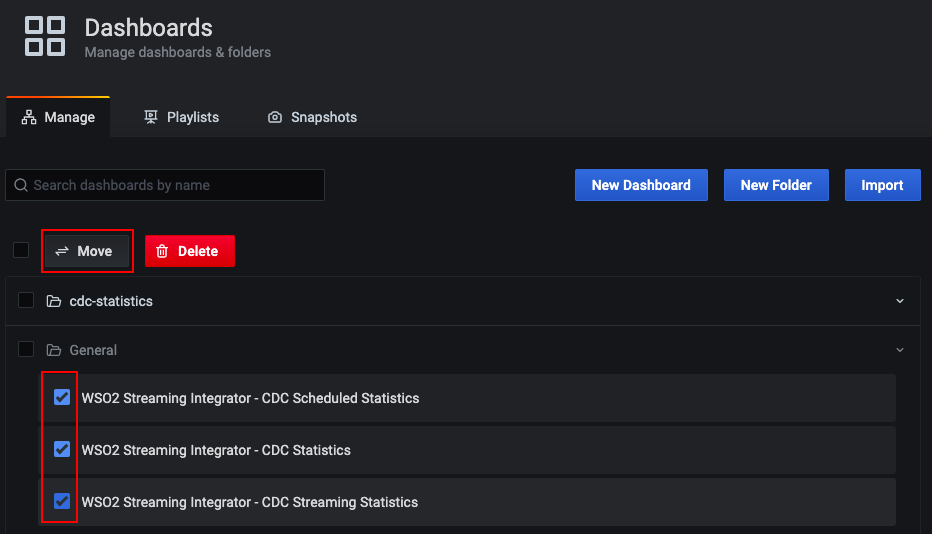
In the Dashboards/Manage tab, select the dashboards you want to move. Then click Move.
-
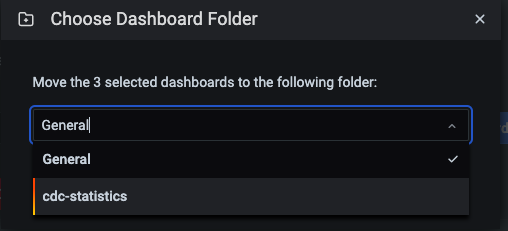
In the Choose Dashboard Folder dialog box that appears, select the folder to which you want to move the selected dashboards.
-
Click Move to move the selected dashboards. A message appears to inform that the selected dashboards are successfully moved, and the Dashboards/Manage tab displays the selected dashboards under the folder you selected to move them.
Deleting dashboards
!!! Before you begin: Download the related JSON file(s) of one or more dashboards from here, and import them to Grafana. For instructions, see Importing dashboards.
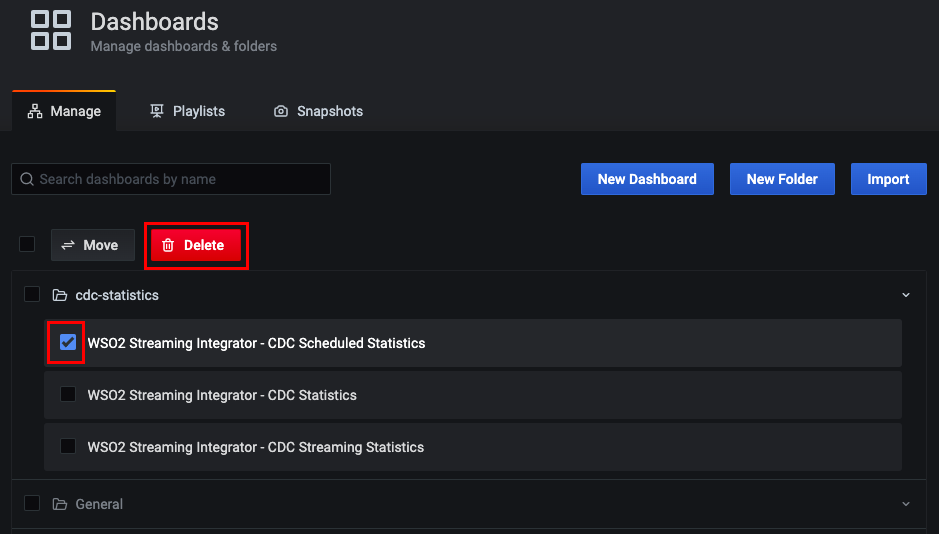
In the Dashboards/Manage tab, select the dashboard(s) you want to delete. Then click Delete.
In the message that appears to confirm whether you want to delete the dashboard, click Delete.
Viewing dashboards
To view a dashboard, follow the procedure below:
-
Navigate to the Dashboards/Manage tab.
-
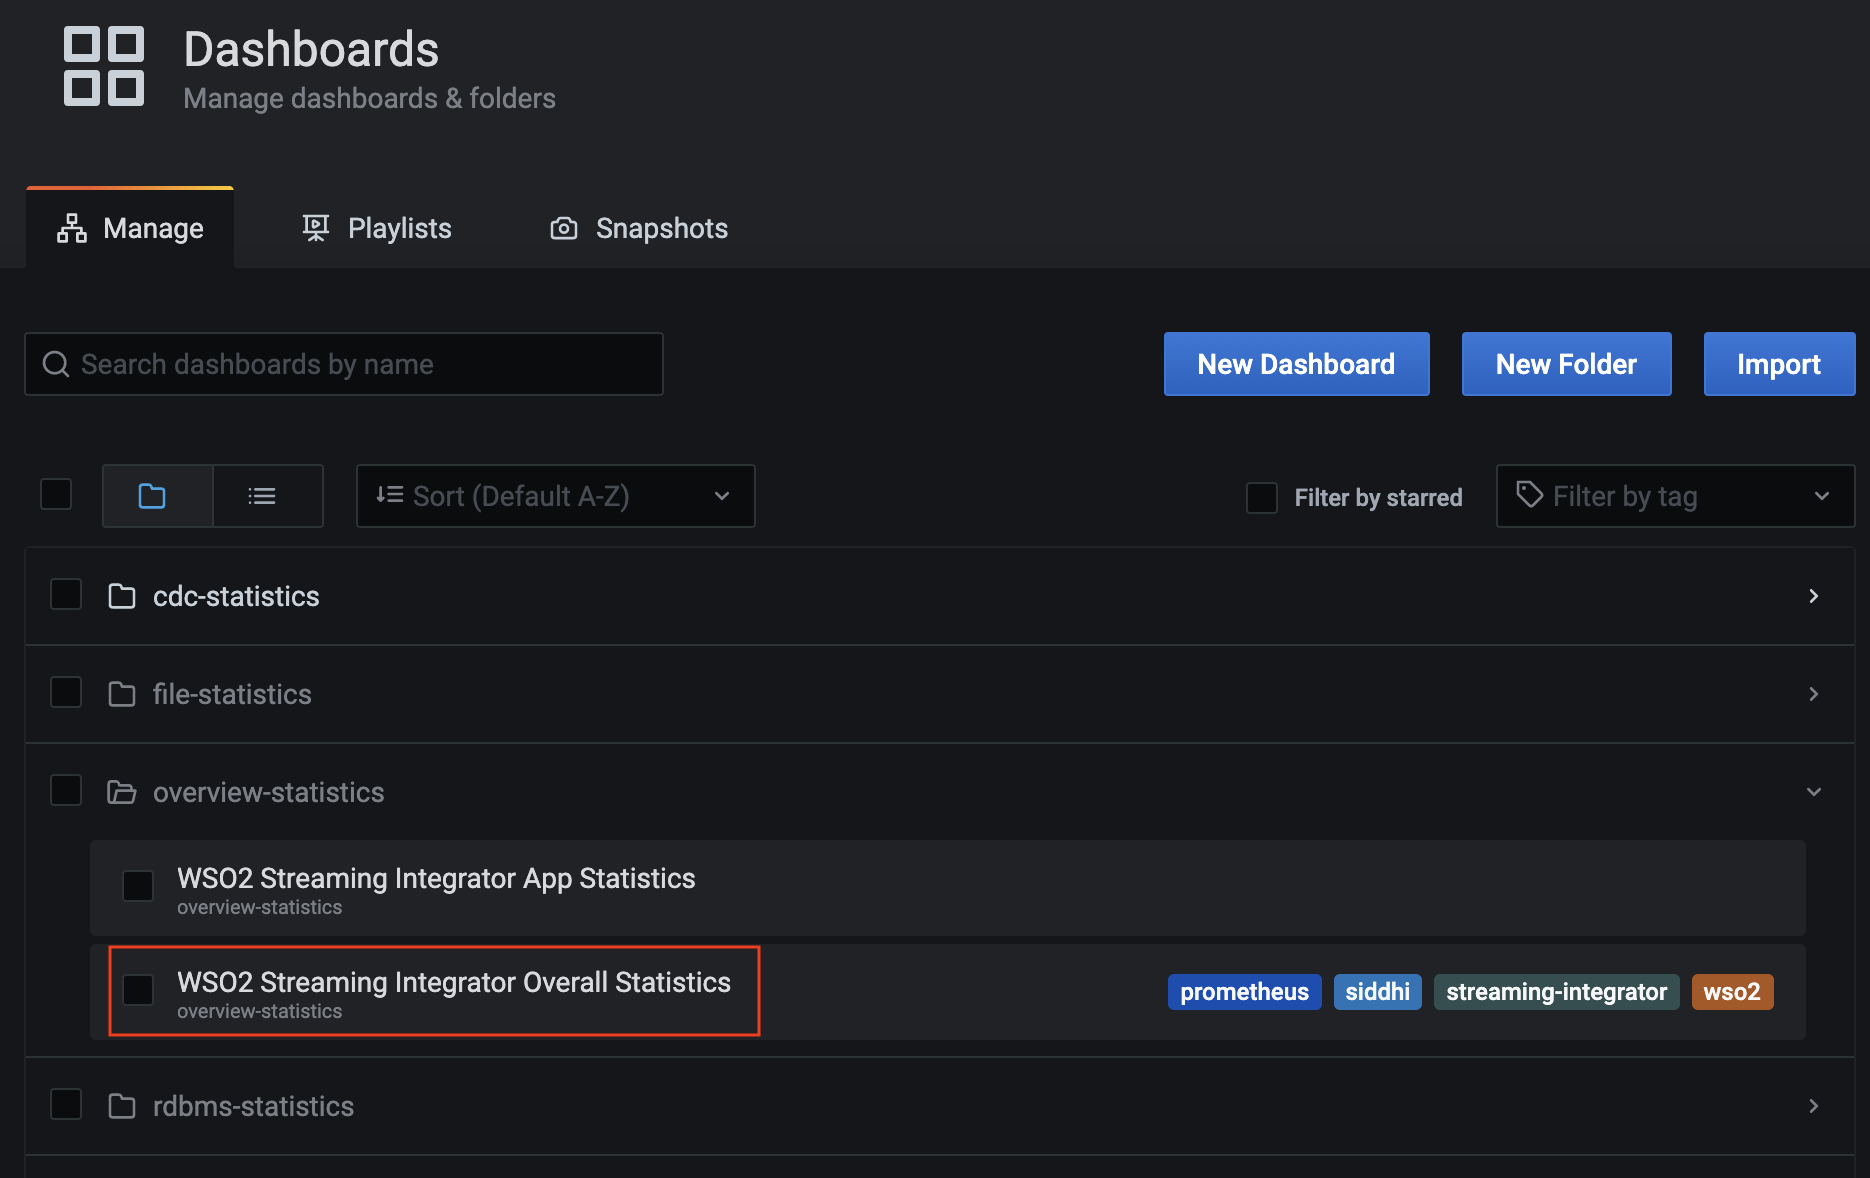
To expand the folder that contains the dashboard you want to view, click on it.
-
Click on the specific dashboard that you want to view.
-
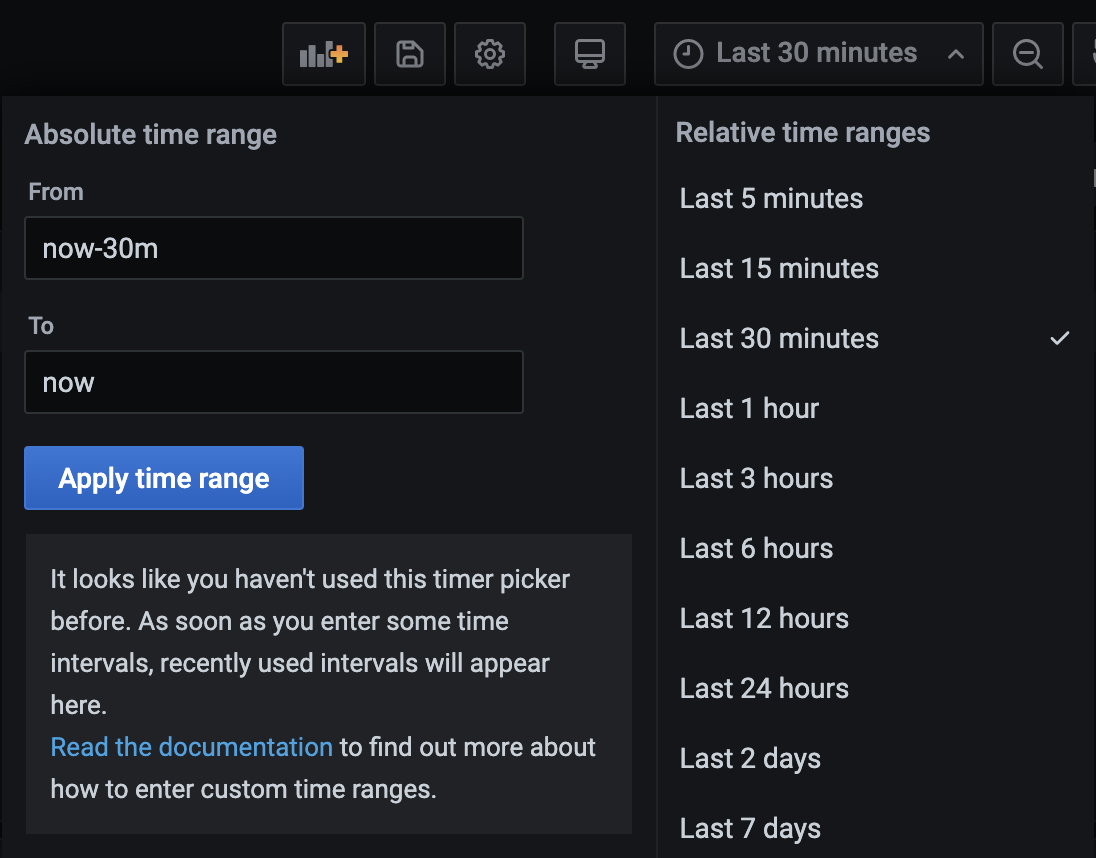
Once the dashboard opens, click on the bar shown below to expand it and specify the time range for which you want to view statistics.
Once you expand the time range bar, you can select the required time interval or specify a custom time interval.