Note
This page is still a work in progress!
Viewing Overall Statistics
This dashboard displays the overall Siddhi statistics of the Siddhi applications currently deployed in your WSO2 Streaming Integrator instance.
There are nine other dashboards linked to the Siddhi overall statistics dashboard which represent the Siddhi components and their statistics. The Siddhi Grafana Dashboard represents the memory, latency and throughput statistics for the Siddhi components as follows.
| No. | Element | Memory | Latency | Throughput |
|---|---|---|---|---|
| 01 | Stream | - | - | ✔️ |
| 02 | Query | ✔️ | ✔️ | - |
| 03 | Source | - | - | ✔️ |
| 04 | Sink | - | - | ✔️ |
| 05 | Source Mapper | - | ✔️ | - |
| 06 | Sink Mapper | - | ✔️ | - |
| 07 | Table | - | ✔️ | ✔️ |
| 08 | Window | ✔️ | ✔️ | ✔️ |
| 09 | Aggregation | ✔️ | ✔️ | ✔️ |
| 10 | Trigger | - | - | ✔️ |
| 11 | On-Demand Query | - | ✔️ | - |
The following information is displayed in this dashboard.
Servers Up/Down
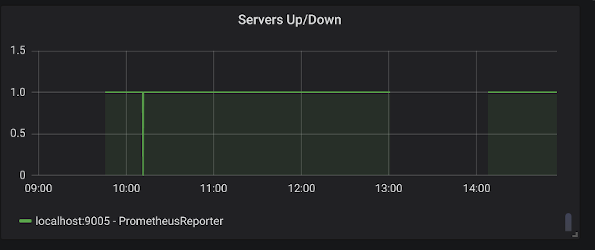
This indicates the number of active servers against time. When a new server is started, it is indicated by a vertical line. You can move the cursor over this vertical line to check the host and port at which the new active server is running.
This also provides a link to the Siddhi Server Statistics dashboard to view server statistics.
Purpose
This allows you to identify the following:
-
The times at which a specific server started and stopped.
-
The duration of time for which a specific server was active.
-
The number of servers that were active at a specific time.
Recommended action
Check the throughput, system load average, memory usage, CPU usage etc., for the time periods during which a specific server/combination of servers was active in order to evaluate server performance.
Siddhi App Count
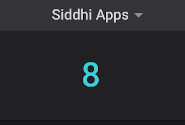
This indicates the total number of Siddhi applications deployed in the currently active servers.
Purpose
This allows you to get an overall understanding of the level of activity carried out by the currently active servers.
Recommended action
If the Siddhi application count is relatively high, you can check the throughput for each Siddhi application to identify the Siddhi applications that you can remove from your Streaming Integrator deployment to reduce the system overhead. To do this, you can filter statistics for each individual Siddhi application in the following dashboards:
- Siddhi Stream Statistics
- Siddhi Source Statistics
- Siddhi Sink Statistics
- Siddhi Query Statistics
- Siddhi Window Statistics
- Siddhi Trigger Statistics
- Siddhi Table Statistics
- Siddhi Aggregation Statistics
- Siddhi On Demand Query Statistics
Server Statistics Summary Table
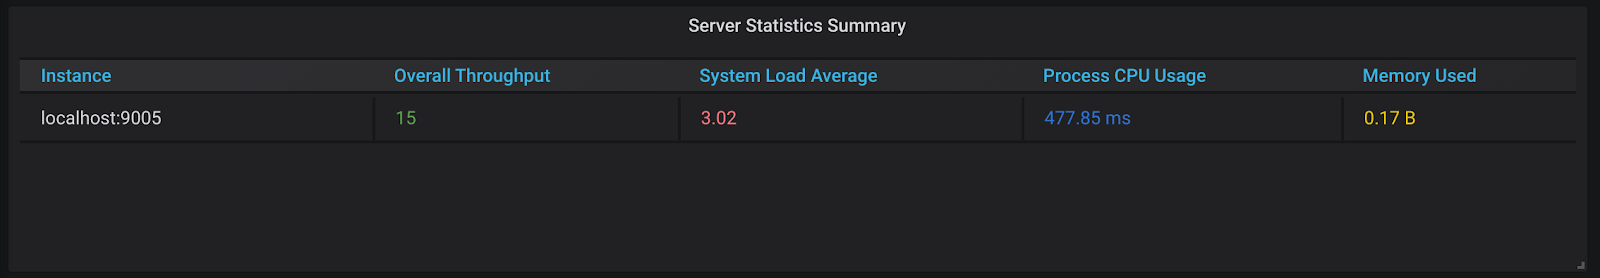
This lists the currently active Streaming Integrator servers and displays the following for each server: - The total events received by the server - The system load average - The total memory used by each server.
Purpose
To evaluate the performance of each server as follows:
- By analysing the efficiency of the server by comparing its events received with the overhead it incurs in terms of the system load average and the memory used.
- By comparing the events received, system load average and the memory usage of each server with that of other servers.
Recommended action
Once you analyze the performance of each server, you can make changes to your Streaming Integrator deployment to use server resources in a more optimum manner (e.g., by removing low performing servers, adding better performing servers, etc.)
Overall Throughput
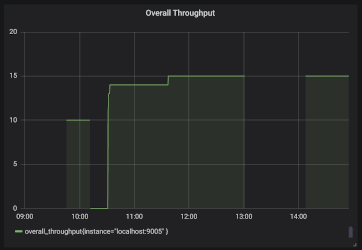
This shows the overall throughput of your current Streaming Integrator deployment.
Purpose
To monitor the overall throughput and evaluate it against other statistics such as the system load average, memory used, the number of Siddhi applications deployed in the system etc.
Recommended action
Determine whether the overall throughput of your Streaming Integrator server is sufficient based on the system resources allocated, and identify ways in which you can improve it (e.g., reducing Siddhi elements that are deployed, but do not generate a sufficient throughput, making adjustments to the system resources allocated. etc.)
System Load Average
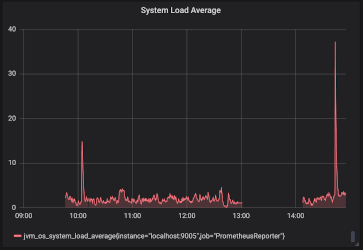
This shows the average system load of your current Streaming Integrator deployment.
Purpose
To monitor the system load average and compare it with other statistics such as the overall throughput, memory used, the number of Siddhi applications deployed in the system etc. and take appropriate measures to reduce it if it is too high, and to optimize the system better if it is relatively low.
Recommended action
If the system load average is too high, you can take appropriate measures to reduce it (by adding more system resources or by identifying Siddhi applications/elements generating a low throughput that you can remove). If the system load average is too low, you can find ways to optimise it (e.g., reducing the system resources allocated, etc.)
CPU Usage
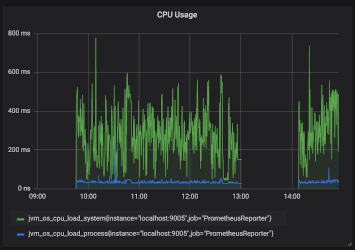
This shows the CPU usage of your current Streaming Integrator deployment.
Purpose
To monitor the CPU usage of your current Streaming Integrator deployment and to identify scenarios where you may need to make changes to the CPU resource allocation.
Recommended action
If there is a spike in the CPU usage, you can identify whether you need to allocate more CPU resources to your deployment or redeploy some of the Siddhi elements with high throughputs to a different Streaming Integrator deployment.
Similarly, if there is a fall in the CPU usage, you can determine whether some of the CPU resources can be removed from the WSO2 Streaming Integrator deployment.
Memory Usage
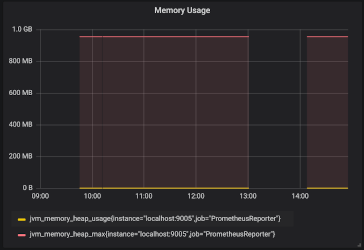
This shows the memory usage of your current Streaming Integrator deployment and to identify scenarios where you may need to make changes to the memory allocation.
Purpose
To monitor the memory usage of your Streaming Integrator deployment and allocate more memory when needed.
Recommended action
If there is a spike in the memory usage, you can identify whether you need to allocate more memory resources to your deployment or redeploy some of the Siddhi elements with high throughputs to a different Streaming Integrator deployment.
Similarly, if there is a fall in the memory usage, you can determine whether some of the memory resources can be removed from the WSO2 Streaming Integrator deployment.
Thread Count
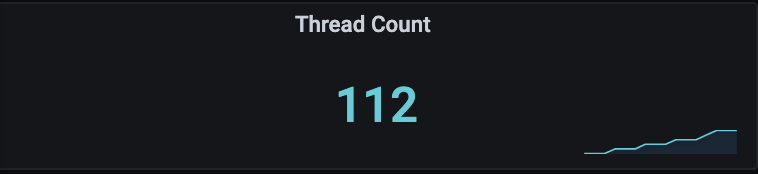
This shows the number of JVM (Java Virtual Machine) threads that are currently active.
Purpose
You can use these statistics to profile your JVM.
Threads Blocked
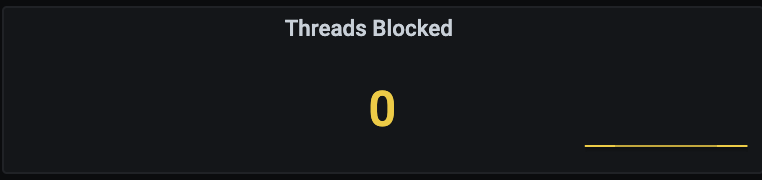
This shows the number of JVM threads that are currently blocked.
Purpose
You can use these statistics to profile your JVM.
Memory Heap Used
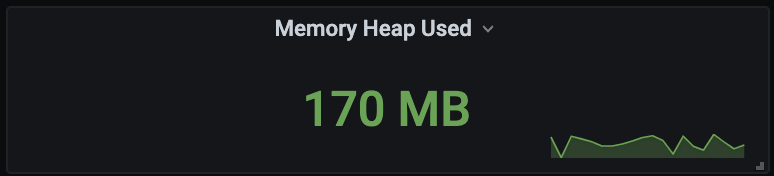
This shows the JVM memory heap that is currently consumed by your Streaming Integrator deployment.
Purpose
You can evaluate the performance of your Streaming Integrator servers based on the memory heap usage.
File Descriptors Open
The number of JVM file descriptors that are currently open.

Stream Statistics
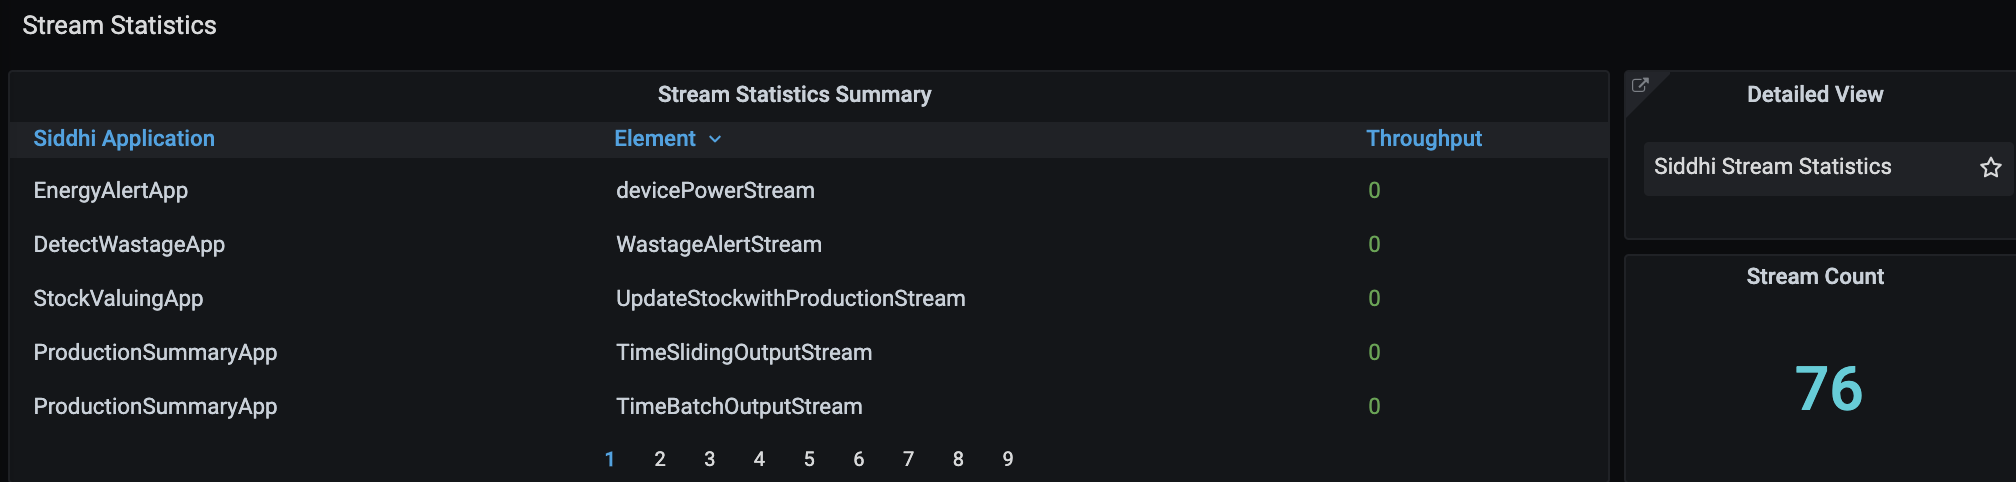
This indicates the following:
-
The complete list of streams in all the Siddhi applications that you are monitoring in your Streaming Integrator deployment.
-
The throughput of each stream listed.
-
The total stream count.
The Stream Statistics widget also provides a link to open the Siddhi Stream Statistics dashboard where you can view stream statistics.
Purpose
This allows you to monitor each stream in your Streaming Integrator deployment and identify the streams that generate a lot of activity.
Recommended action
Filter stream statistics for each Siddhi application to identify active Siddhi applications. You can also identify streams that are duplicated in different Siddhi applications and merge such Siddhi applications if possible to reduce system overhead.
Query Statistics
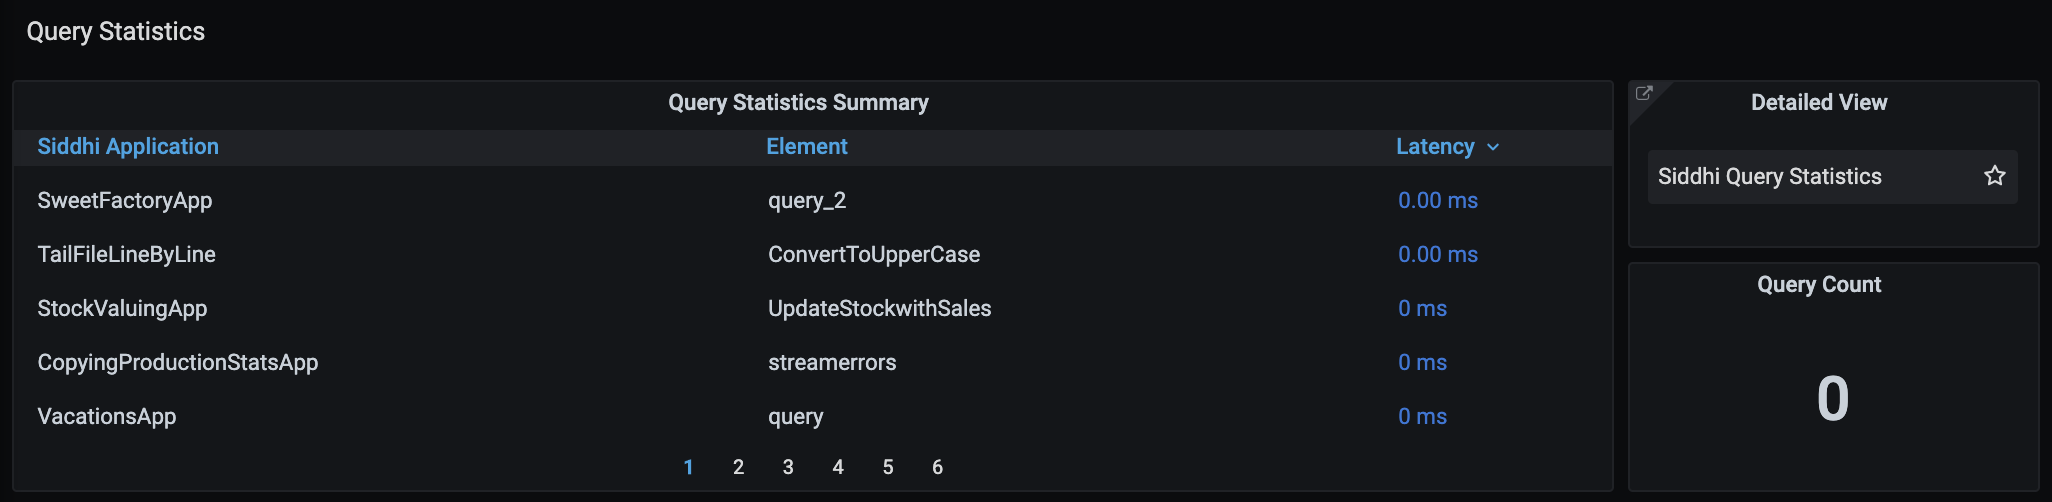
This indicates the following:
-
The complete list of queries in all the Siddhi applications that you are monitoring in your Streaming Integrator deployment.
-
The latency of each query listed.
-
The total query count.
The Query Statistics widget also provides a link to the Siddhi Query Statistics dashboard where you can view query statistics.
Purpose
This allows you to monitor each query in your WSO2 Streaming Integrator deployment and identify the main queries to be reviewed in order to reduce the overall latency.
Recommended action
Identify queries with high latency and review them to use the Siddhi logic in a more efficient manner. You can also identify queries that are duplicated in different Siddhi applications and merge such Siddhi applications if possible to reduce system overhead
Source and Source Mapper Statistics
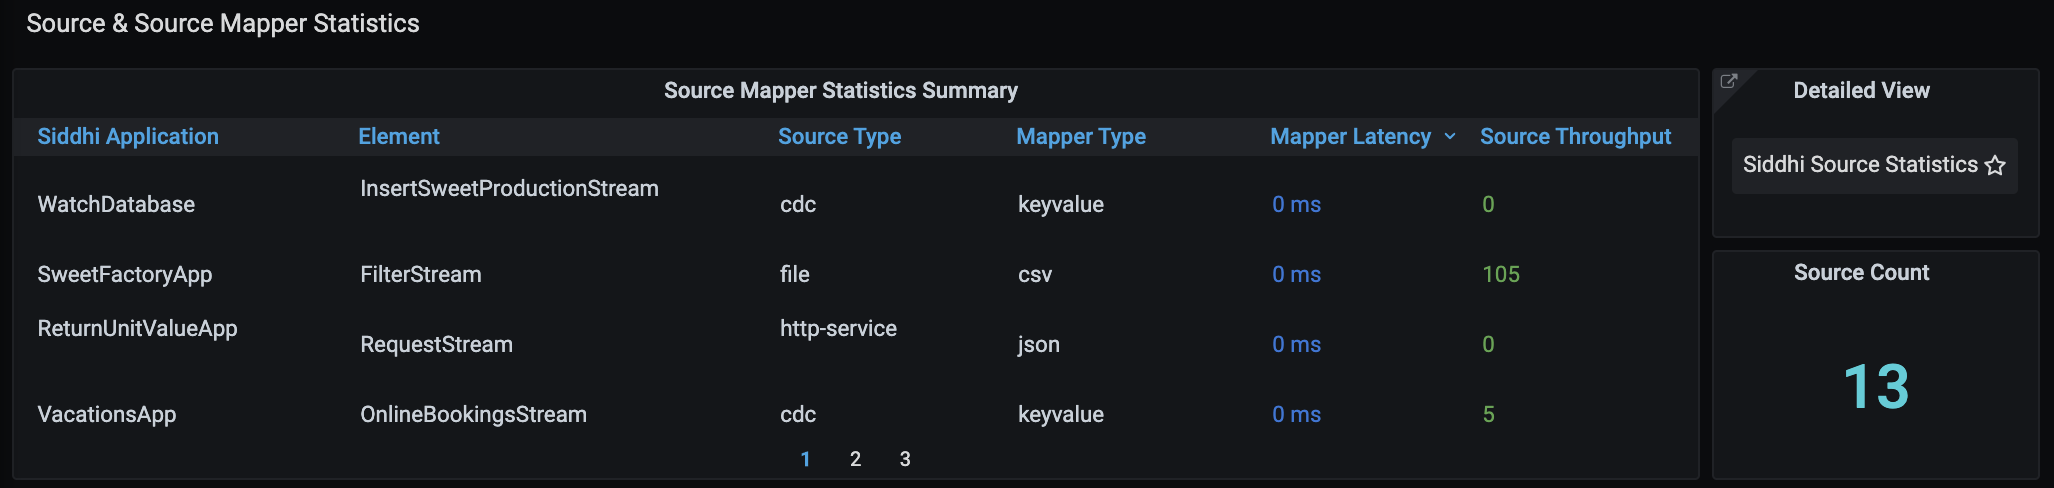
This indicates the following:
-
The complete list of sources in all the Siddhi applications that you are monitoring in your Streaming Integrator deployment.
-
The throughput of each source listed.
-
The total source count in all the Siddhi applications you have selected to monitor.
The Source and Source Mapper Statistics widget also provides a link to the Siddhi Source Statistics dashboard where you can view source statistics.
Purpose
To monitor how each source contributes to the overall throughput of your Siddhi application deployment.
Recommended action
Sink Statistics
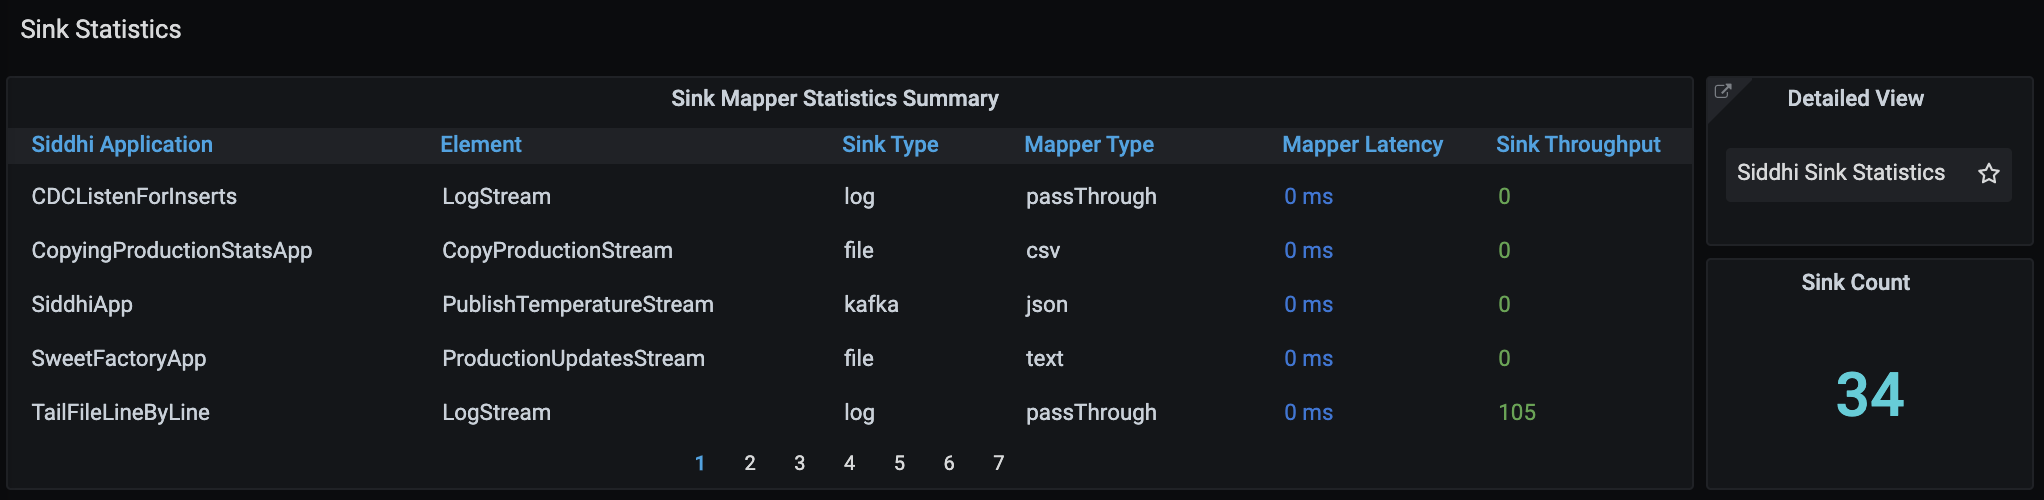
This indicates the following:
-
The complete list of sinks in all the Siddhi applications that you are monitoring in your Streaming Integrator deployment.
-
The throughput of each sink listed.
-
The total sink count in all the Siddhi applications you have selected to monitor.
The Sink Statistics widget also provides a link to the Siddhi Sink Statistics dashboard where you can view sink statistics.
Purpose
To monitor the amount of data published by your WSO2 Streaming Integrator deployment to different destinations, brokers, files, databases and cloud storages.
Recommended action
Table Statistics
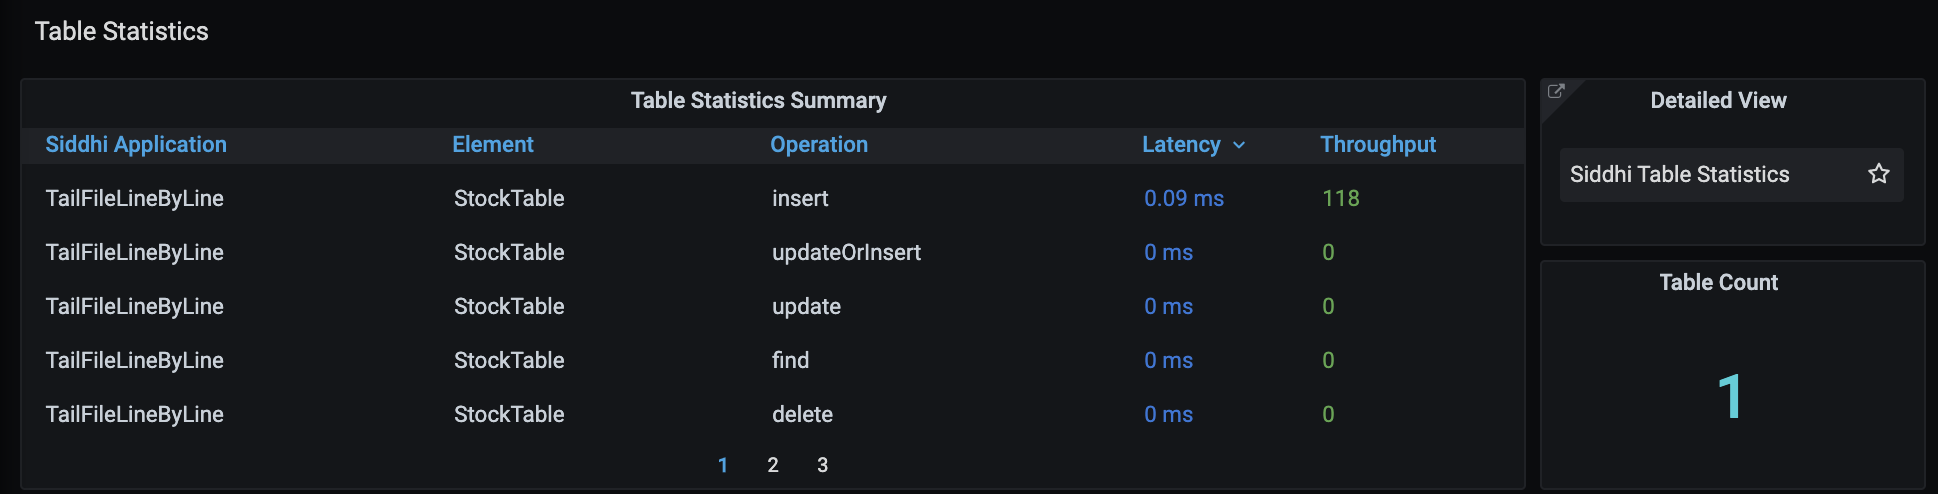
This indicates the following:
-
The complete list of tables in all the Siddhi applications that you are monitoring in your Streaming Integrator deployment.
-
The throughput of each table listed.
-
The total table count in all the Siddhi applications you have selected to monitor.
The Table Statistics widget also provides a link to the Siddhi Table Statistics dashboard where you can view table statistics.
Purpose
To monitor the tables defined in your WSO2 Streaming Integrator deployment and assessing the extent to which each table is used.
Recommended action
Window Statistics
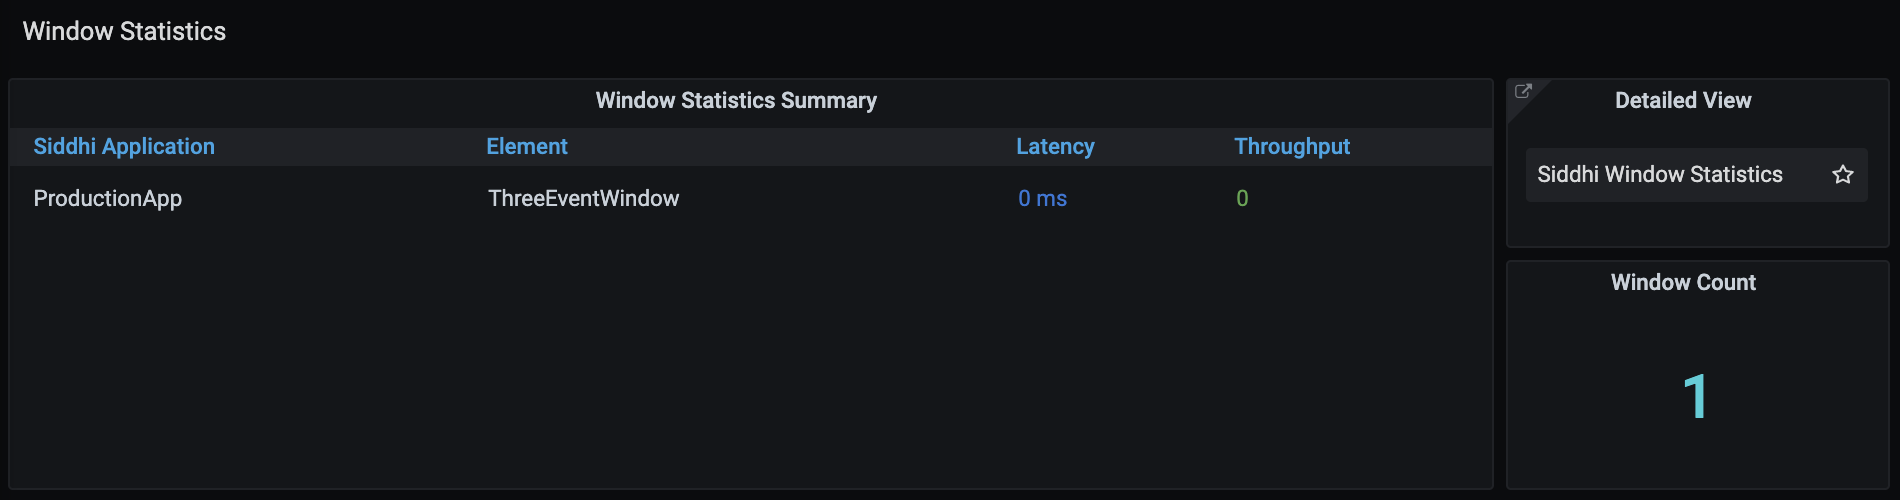
This indicates the following:
-
The complete list of windows in all the Siddhi applications that you are monitoring in your Streaming Integrator deployment.
-
The throughput of each window listed.
-
The total window count in all the Siddhi applications you have selected to monitor.
The Window Statistics widget also provides a link to the Siddhi Window Statistics dashboard where you can view window statistics.
Purpose
To monitor the windows defined in your WSO2 Streaming Integrator deployment and assessing the extent to which each window is used.
Recommended action
Aggregation Statistics
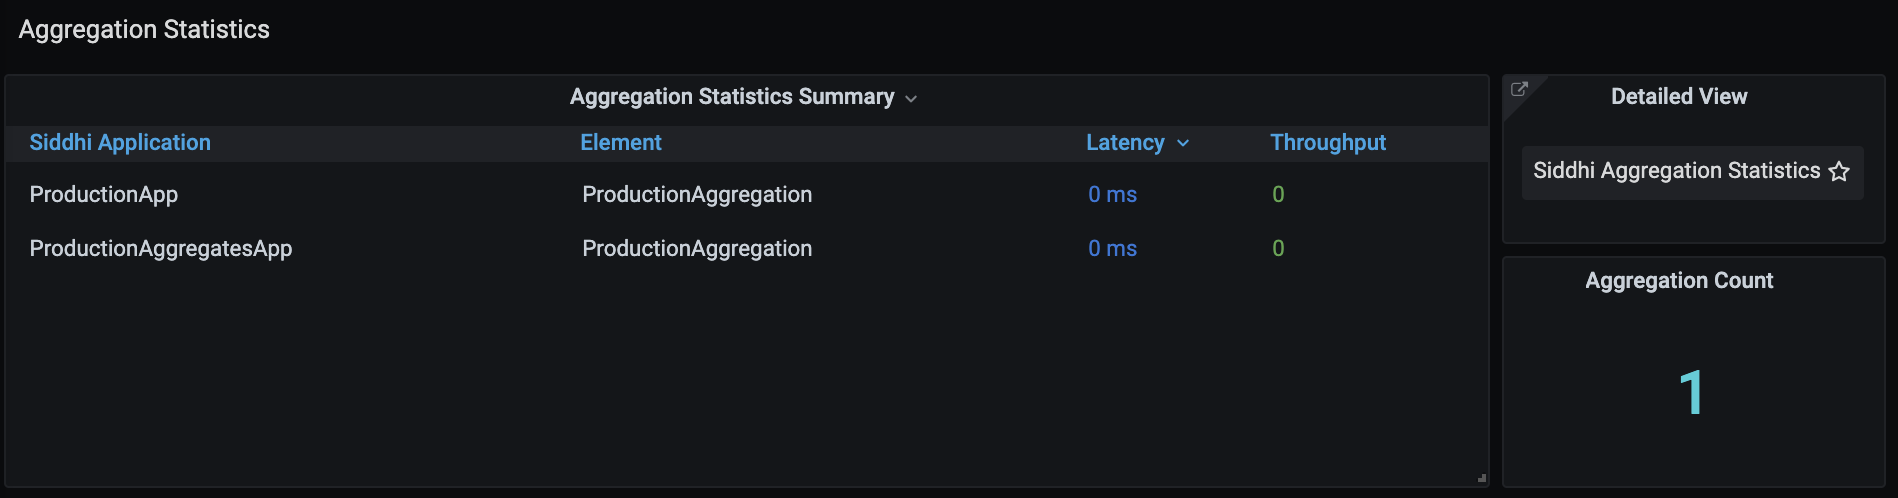
This indicates the following:
-
The complete list of aggregations in all the Siddhi applications that you are monitoring in your Streaming Integrator deployment.
-
The throughput of each aggregation listed.
-
The total aggregation count in all the Siddhi applications you have selected to monitor.
The Aggregation Statistics widget also provides a link to the Siddhi Aggregation Statistics dashboard where you can view aggregation statistics.
Purpose
To monitor the aggregations defined in your WSO2 Streaming Integrator deployment and assessing the extent to which each aggregation is used.
Recommended action
Trigger Statistics
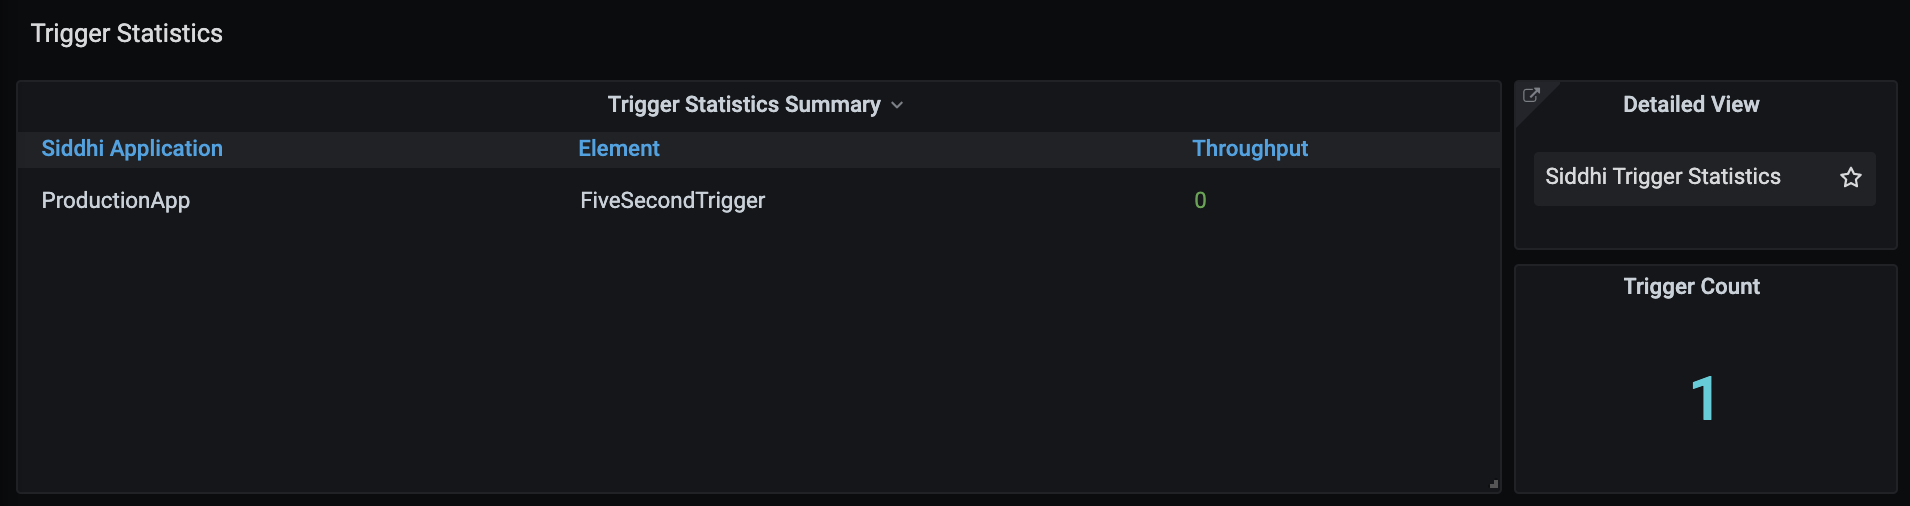
This indicates the following:
-
The complete list of triggers in all the Siddhi applications that you are monitoring in your Streaming Integrator deployment.
-
The throughput of each trigger listed.
-
The total trigger count in all the Siddhi applications you have selected to monitor.
The Trigger Statistics widget also provides a link to the Siddhi Trigger Statistics dashboard where you can view trigger statistics.
Purpose
To monitor the triggers defined in your WSO2 Streaming Integrator deployment and assessing the extent to which each trigger is used.
Recommended action
On Demand Query Statistics

This indicates the following:
-
The complete list of on demand queries you have carried out via REST API for the Siddhi applications you have selected to monitor.
-
The throughput of each on-demand query listed.
-
The total on-demand query count.
The On-Demand Query Statistics widget also provides a link to the Siddhi On-Demand Query Statistics dashboard where you can view on-demand query statistics.
Purpose
Recommended action