Monitoring ETL Flows with Grafana
Before you begin:
To enable WSO2 Streaming Integrator to publish statistics in Grafana, follow the instructions in Setting up Grafana to Display WSO2 SI Statistics.
Setting Up Grafana to Monitor WSO2 Streaming Integrator
For the purpose of monitoring ETL (Extract, Transform, Load) statistics WSO2 provides nine pre-configured dashboards. To view them in Grafana, follow the steps below:
-
Download the following dashboards (i.e., the JSON file with the dashboard configuration) from here.
-
Start and access Grafana. Then import the nine dashboards you downloaded in the previous step. For more information, see Managing Grafana Dashboards - Importing Dashboards.
-
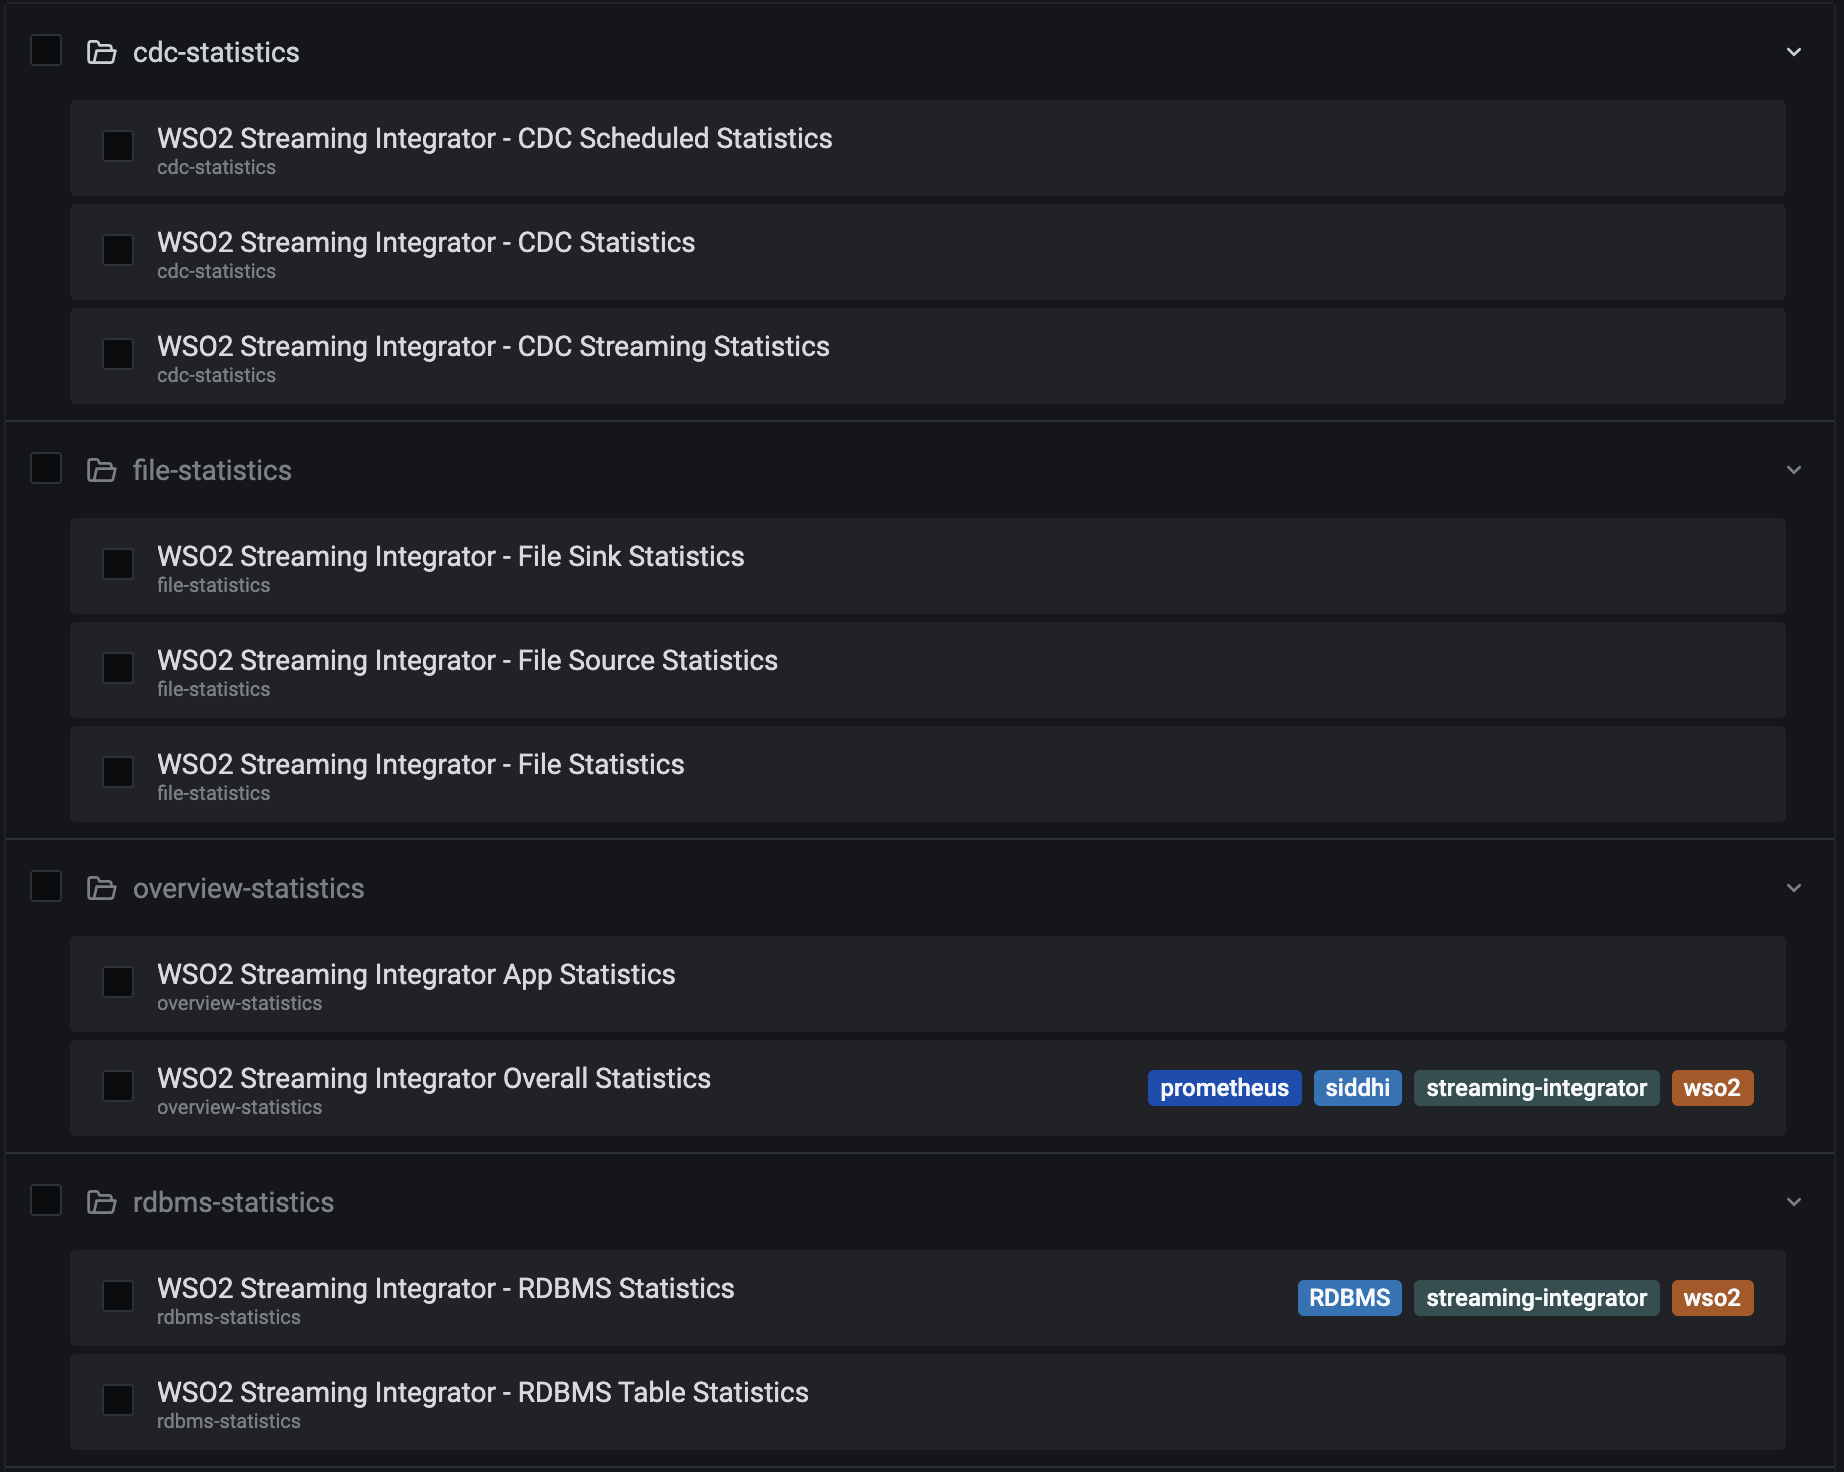
In the Dashboards/Manage tab, create four new folders named
overview-statistics,file-statistics,rdbms-statistics,cdc-statistics, andkafka-statistics. Then organize the dashboards you imported in the new folders you created as shown in the image below. For instructions, see Managing Grafana Dashboards - Organizing Dashboards in Folders.Info
The following is a suggested method to organize your dashboards, and the following instructions are provided based on this structure.
Accessing Grafana Dashboards for Monitoring
To navigate through the Grafana dashboards you set up for monitoring WSO2 Streaming Integrator and to analyze statistics, follow the procedure below:
-
To start and access the dashboards in Grafana, follow the steps below:
-
Start the Prometheus server by issung the following command from the
<PROMETHEUS_HOME>directory../prometheus -
Start Grafana.
Info
The procedure to start Grafana depends on your operating system and the installation process. e.g., If your operating system is Mac OS and you have installed Grafana via Homebrew, you start Grafana by issuing the
brew services start grafanacommand. -
Start the WSO2 Streaming Integrator server by navigating to the
<SI_HOME>/bindirectory, and issuing the appropriate command out of the following based on your operating system.- For Linux:
./server.sh - For Windows:
server.bat
- For Linux:
Access Grafana via
http://localhost:3000/. -
-
In the left pane, click the Dashboards icon, and then click Manage to open the Dashboards page.
-
In the Dashboards page, click WSO2 Streaming Integrator Overall Statistics.
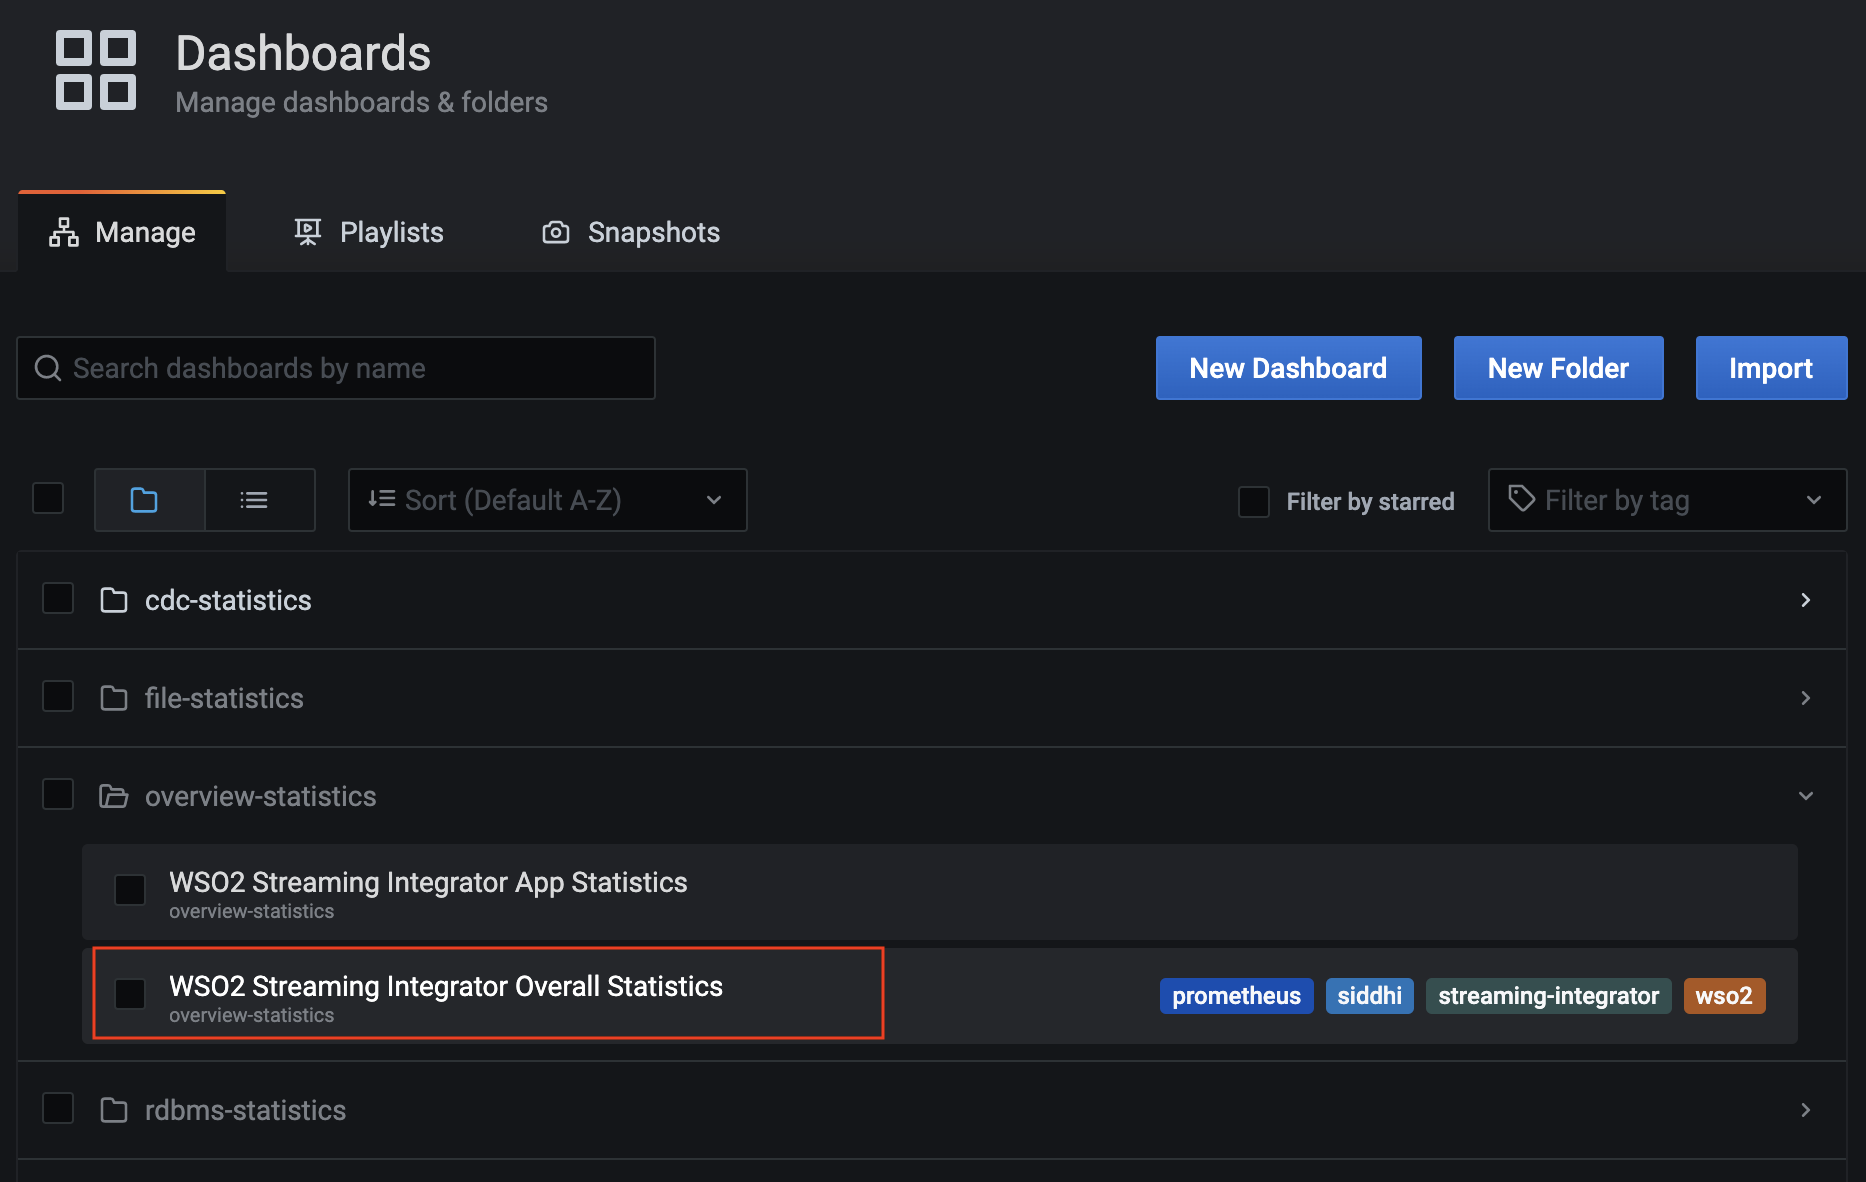
The overall statistics are displayed as shown in the following example.
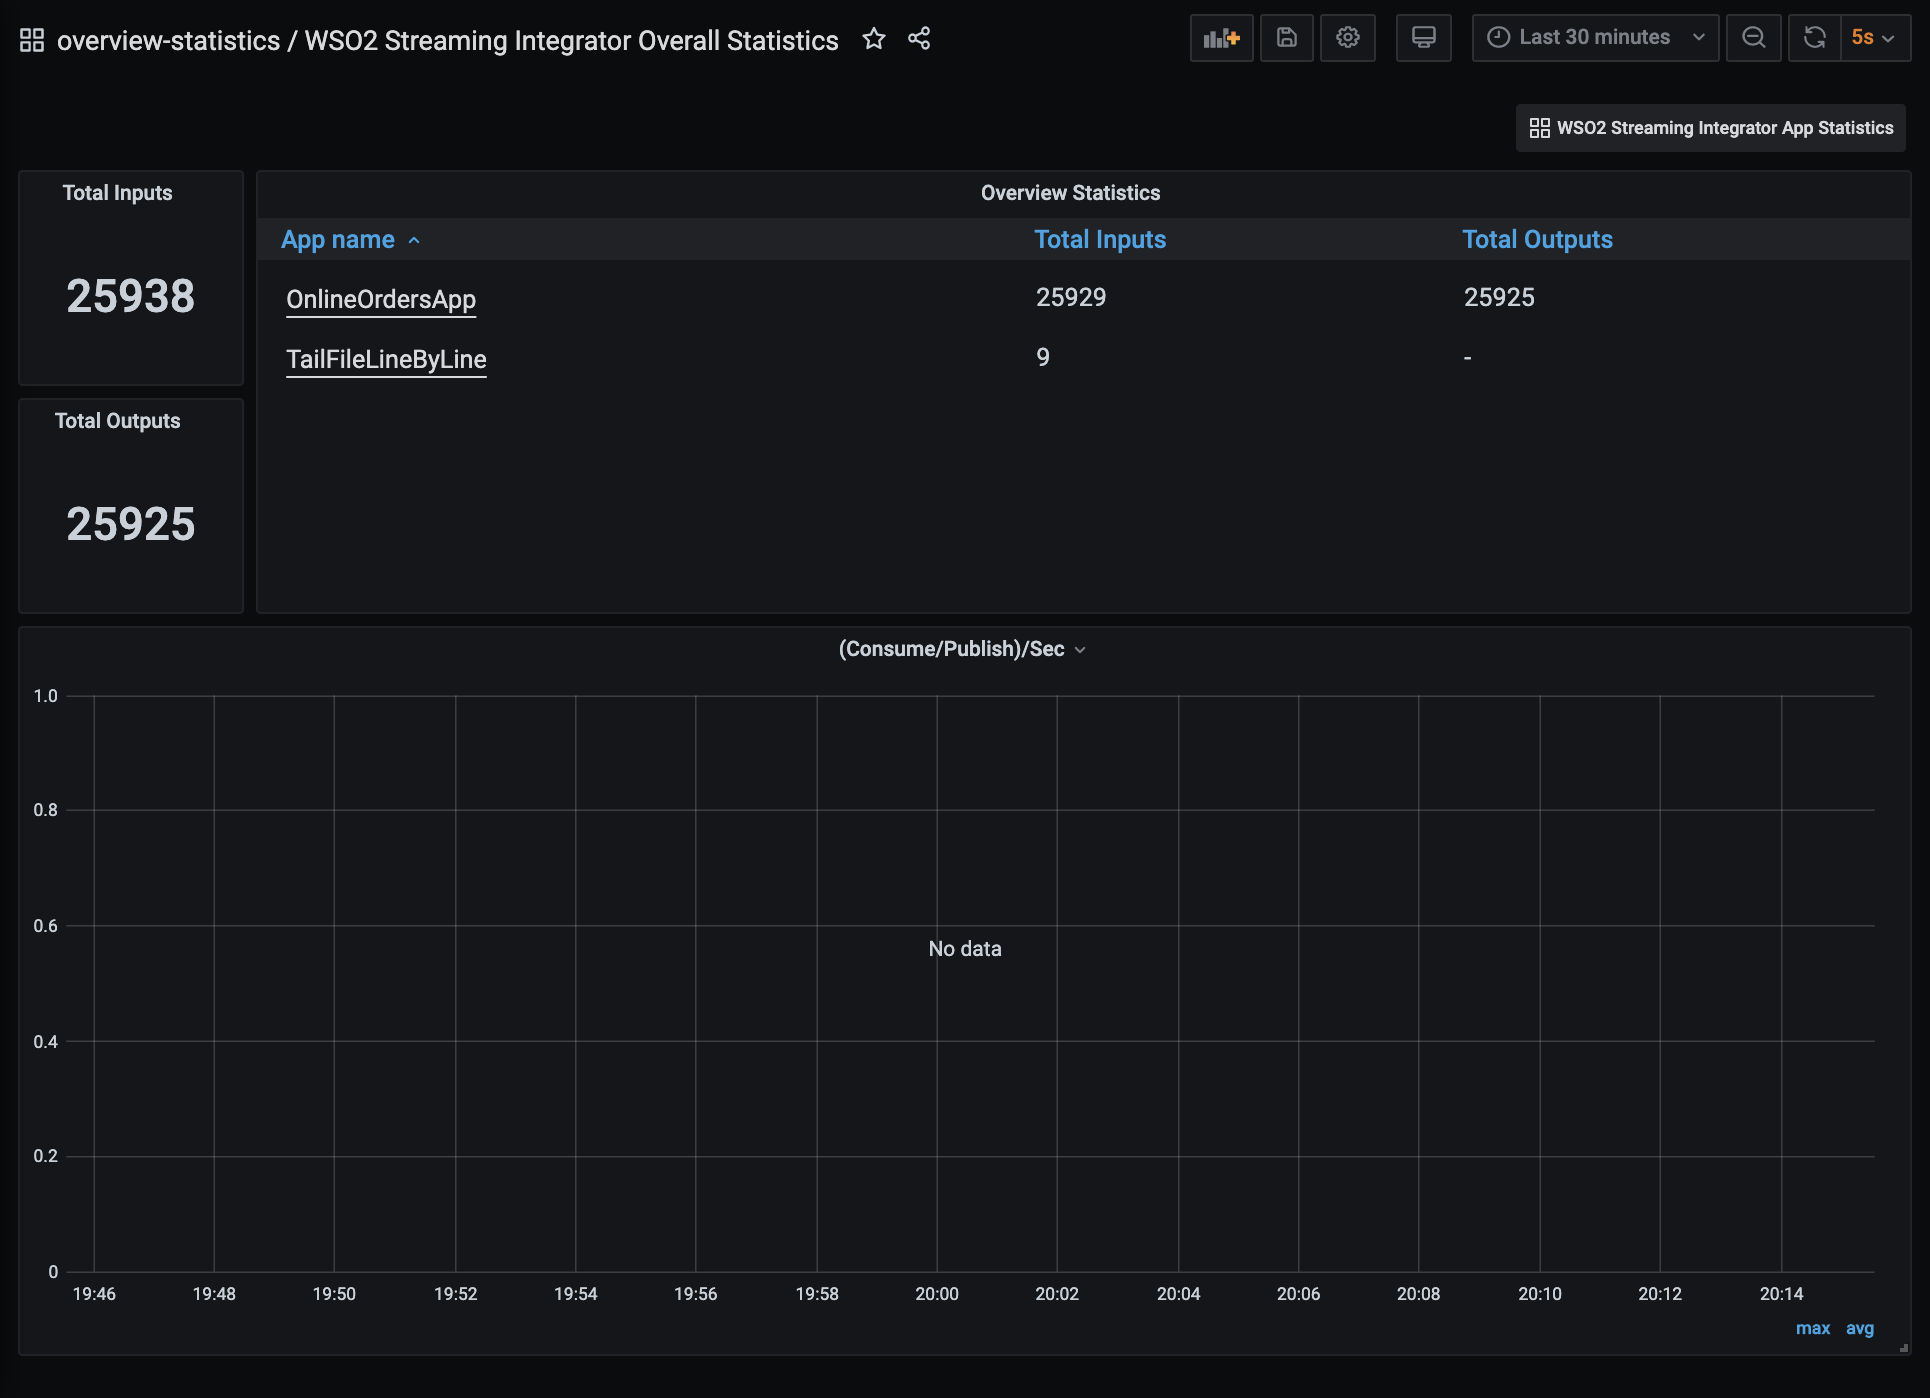
This provides an overview on the overall performance of the WSO2 Streaming Integrator instance by displaying the total number of input events consumed and the total number of output events. It also provides the breakdown of the total inputs and outputs by Siddhi application. The (Consume/Publish)/Sec graph indicates the rate at which the consumed input events are published per second.
-
To view the statistics specific to a Siddhi application, click on the relevant Siddhi application.
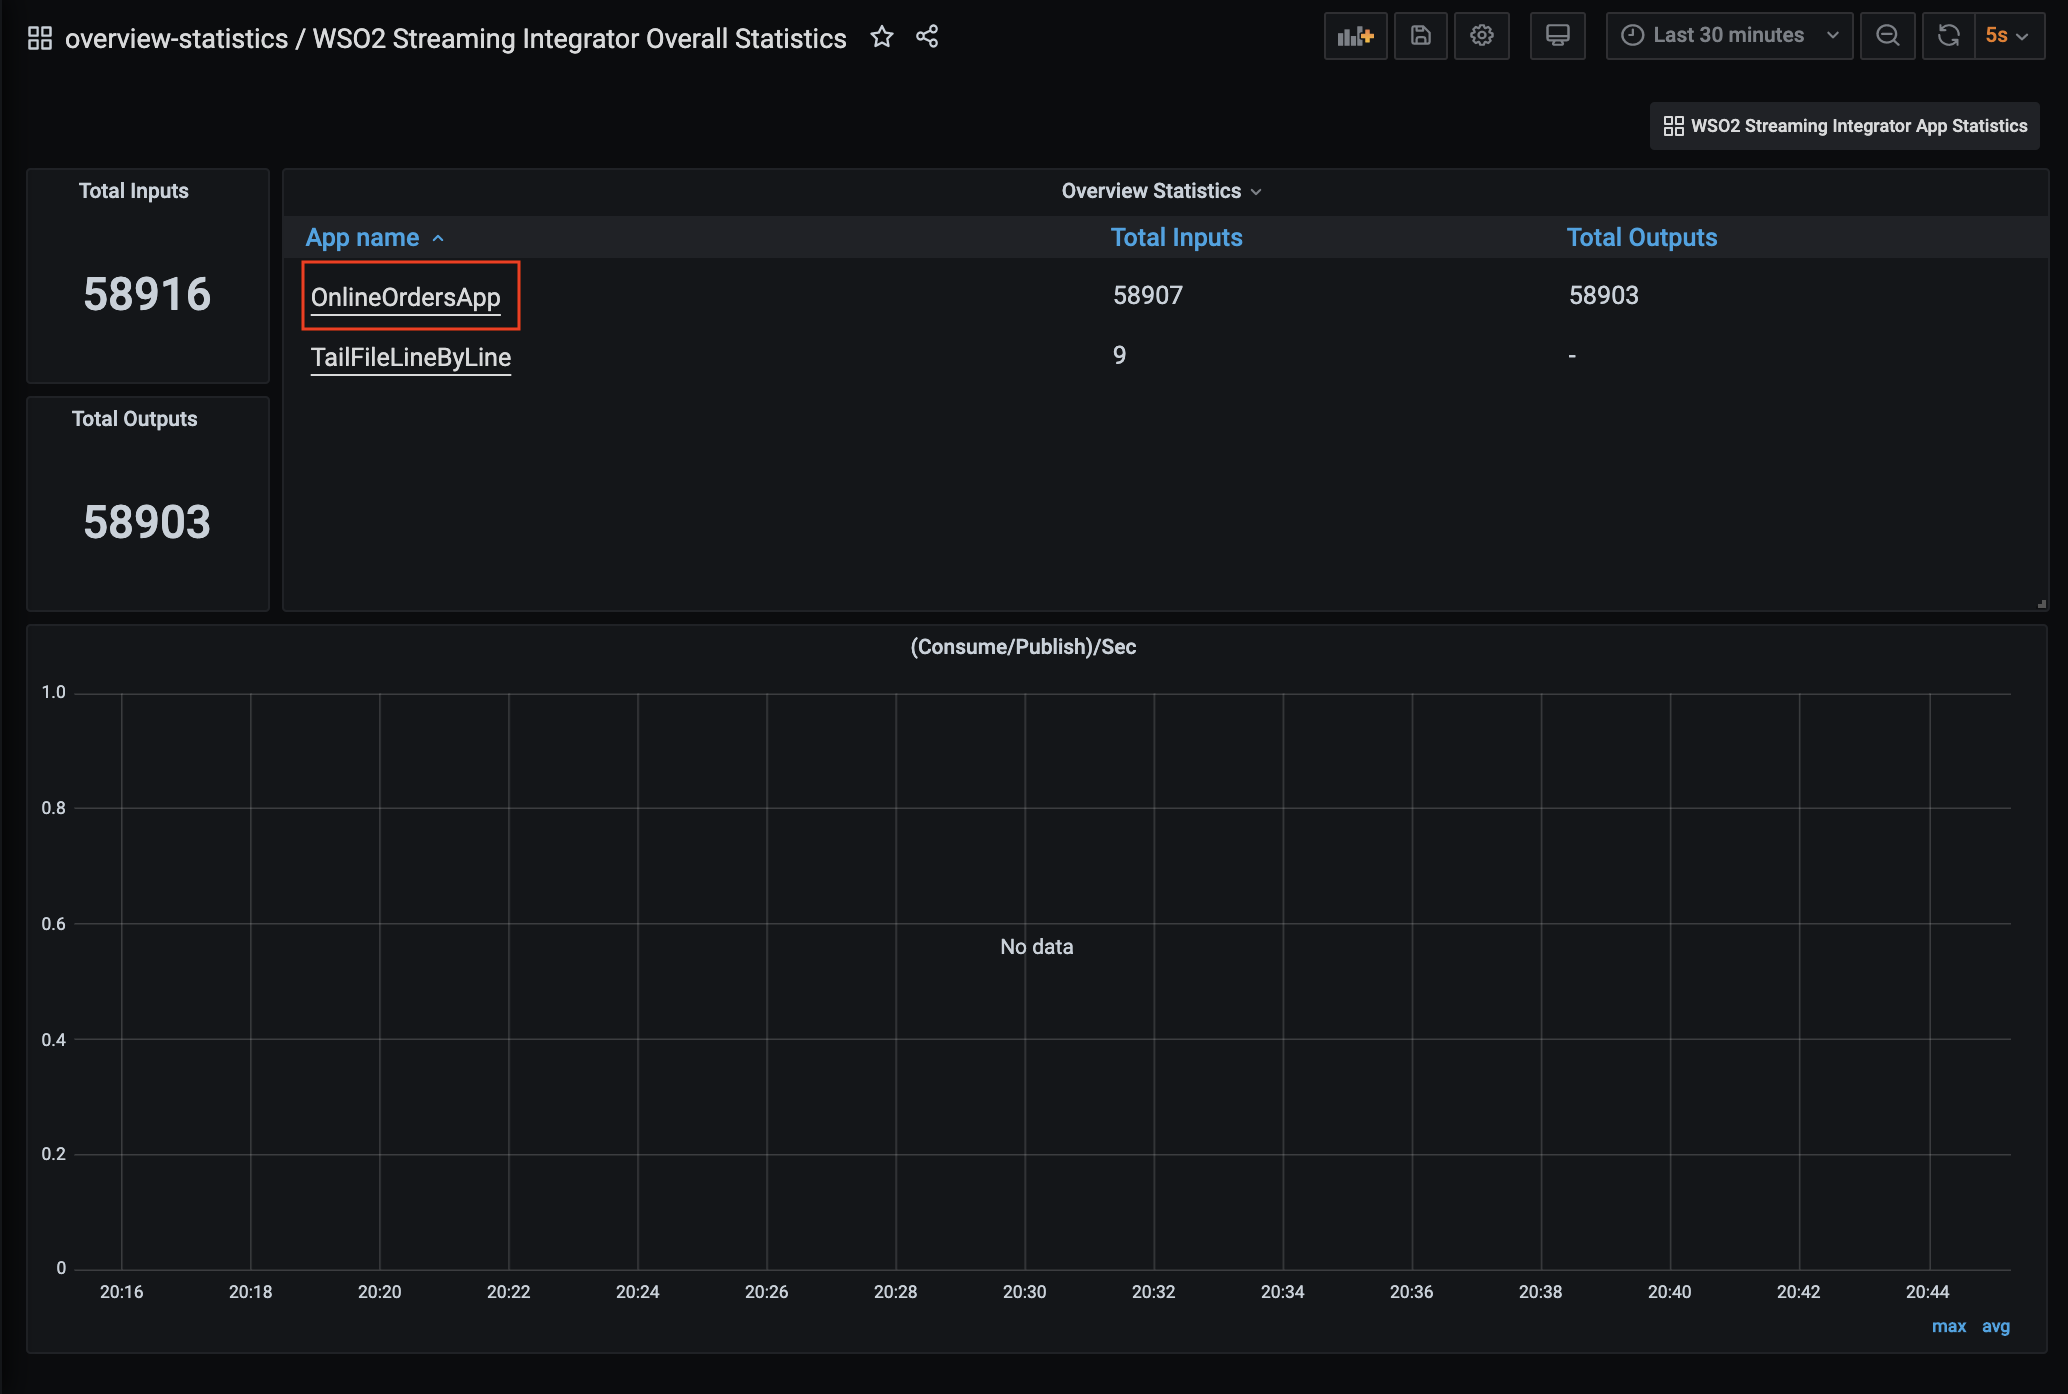
The WSO2 Streaming Integrator App Statistics dashboard opens. This allows you to access any statistics relating to change data capture, file processing and data store integration activities carried out via the selected Siddhi application.
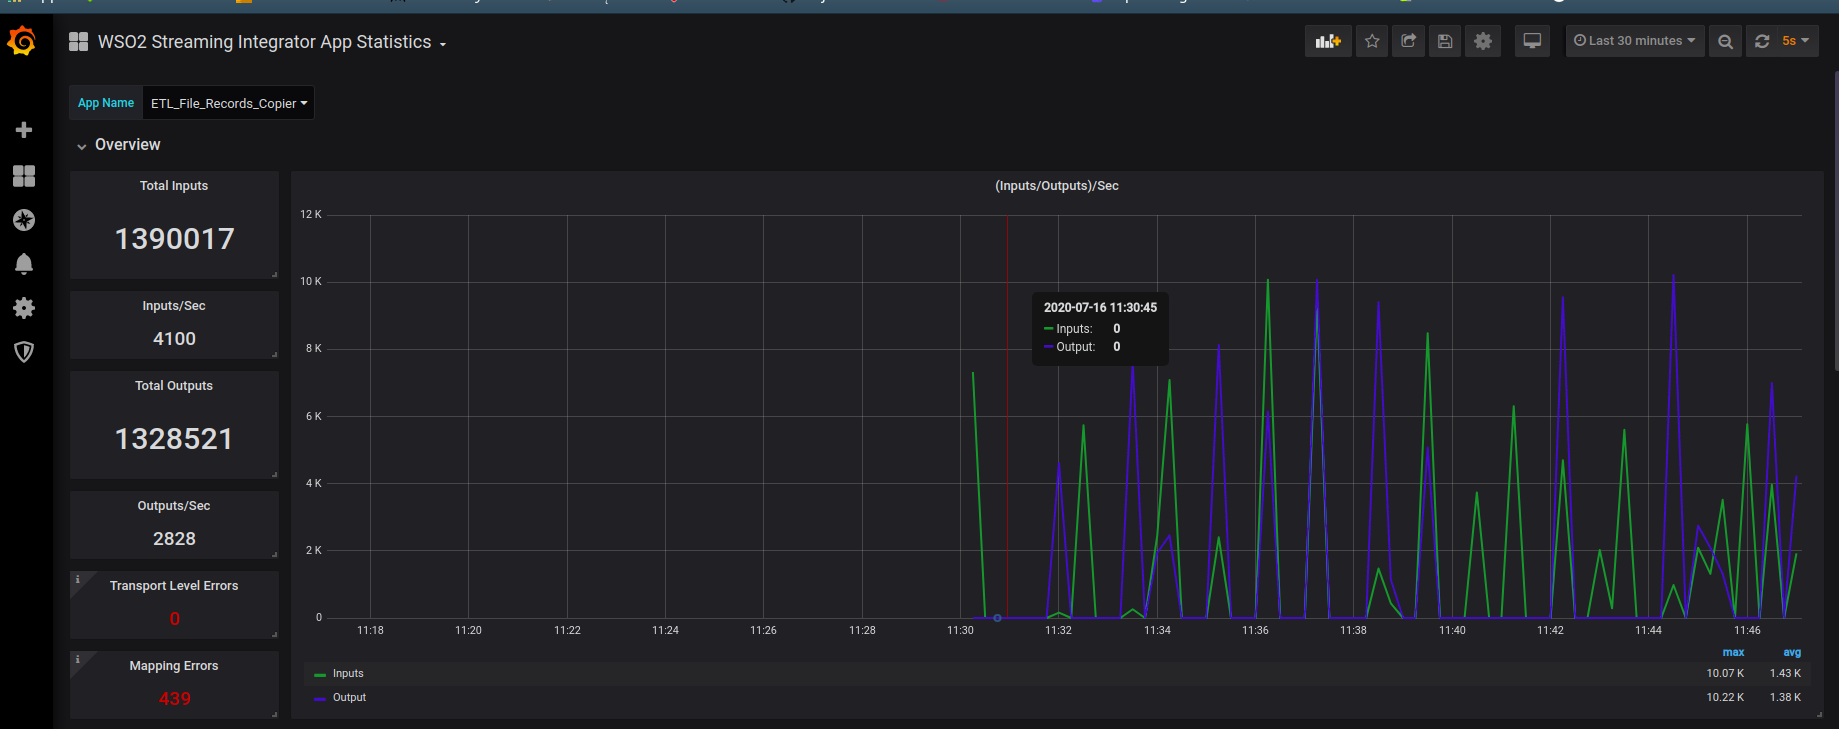
Viewing CDC statistics**
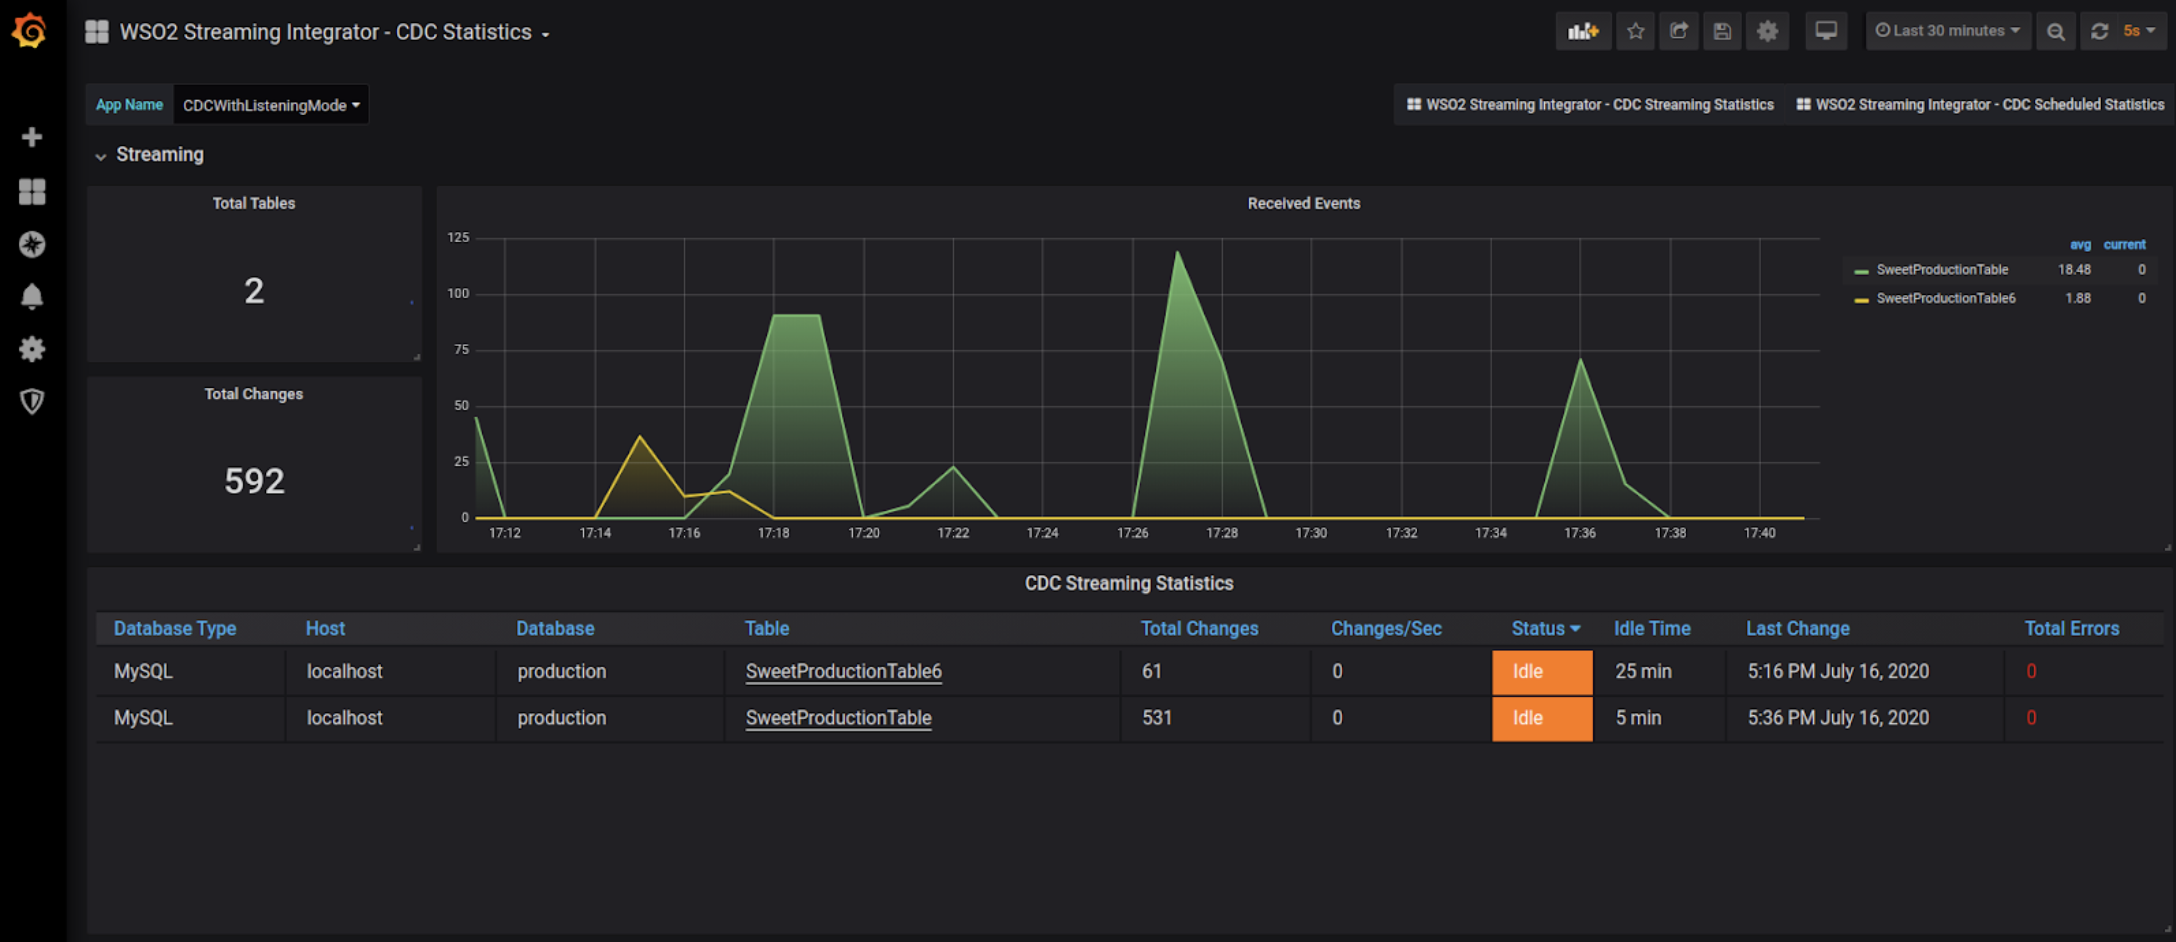
CDC related statistics are displayed in the Sources section of the WSO2 Streaming Integrator App Statistics dashboard. To view the detailed statistics for a specific table, click on that table.
As a result, the CDC Statistics dashboard opens with change data statistice specific to that table.
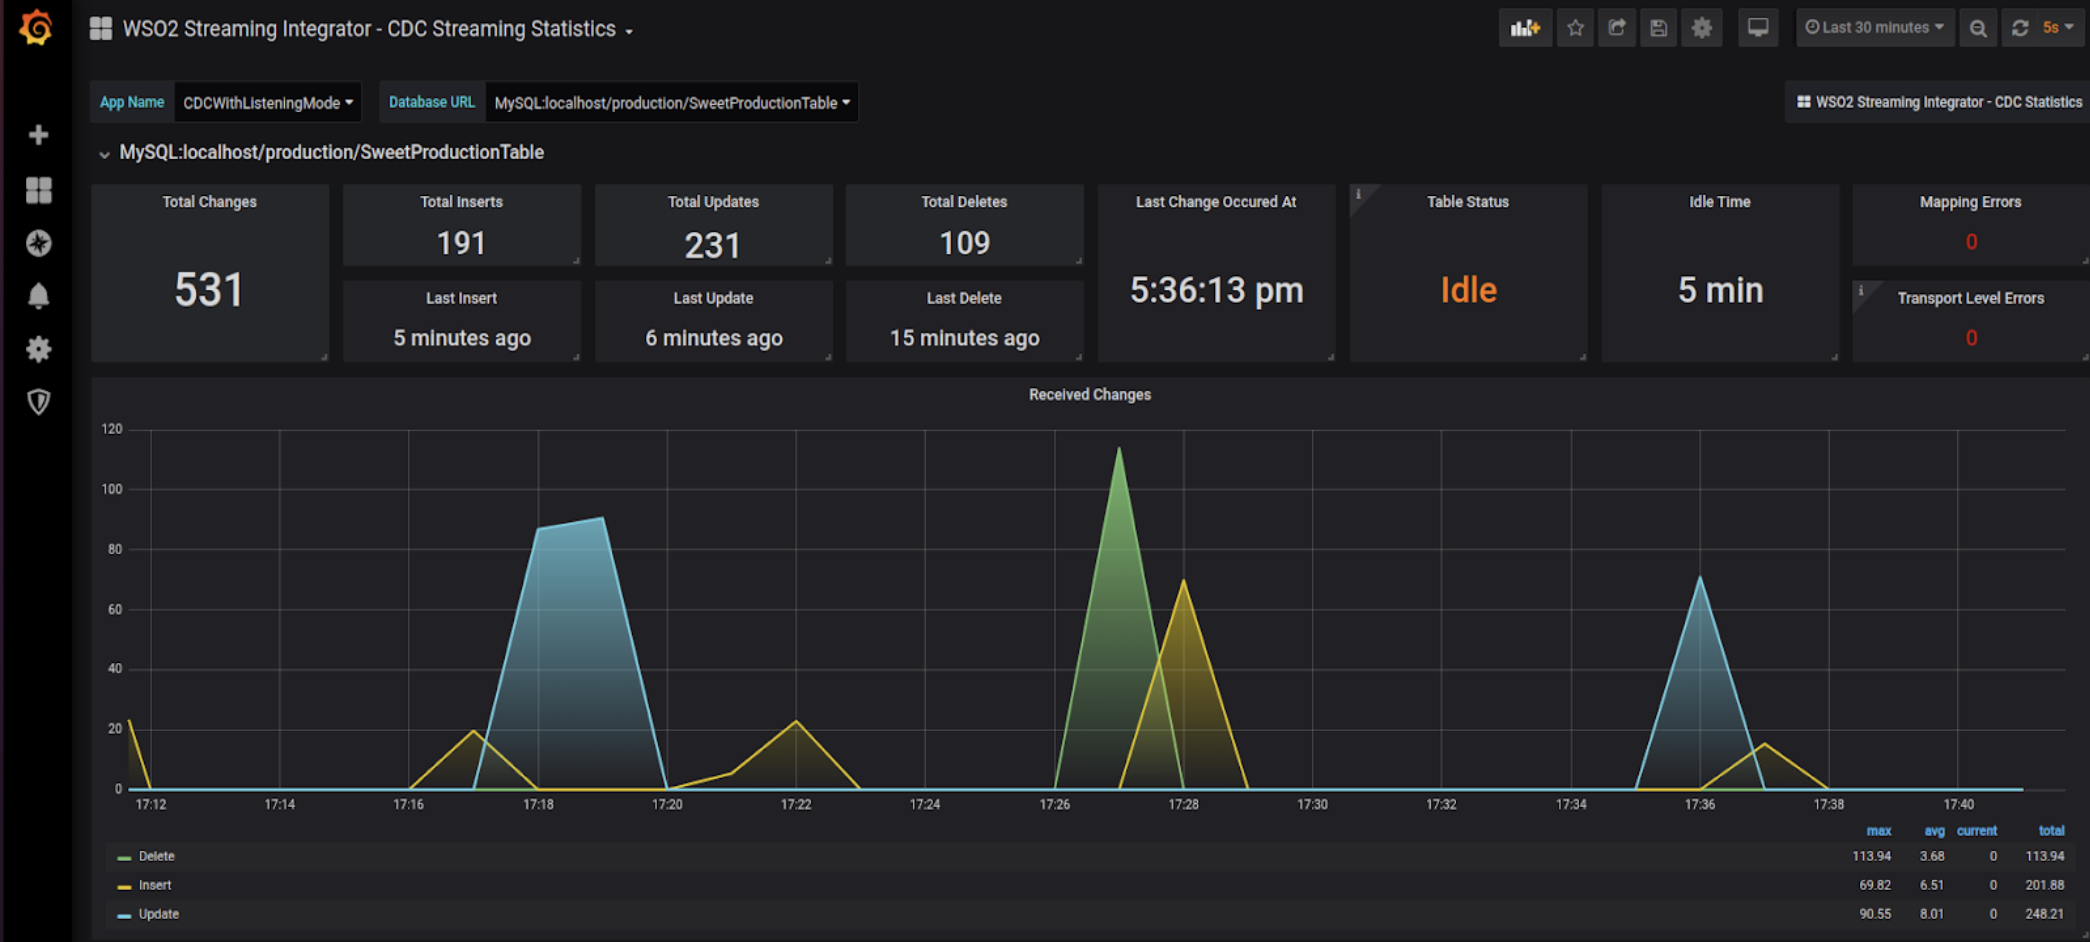
If you click on a table for which change data is captured in a streaming manner (i.e., a table in the CDC Streaming Statistics section), the CDC Streaming Statistics dashboard opens with change data related statistics specific to the selected table as shown in the example below.
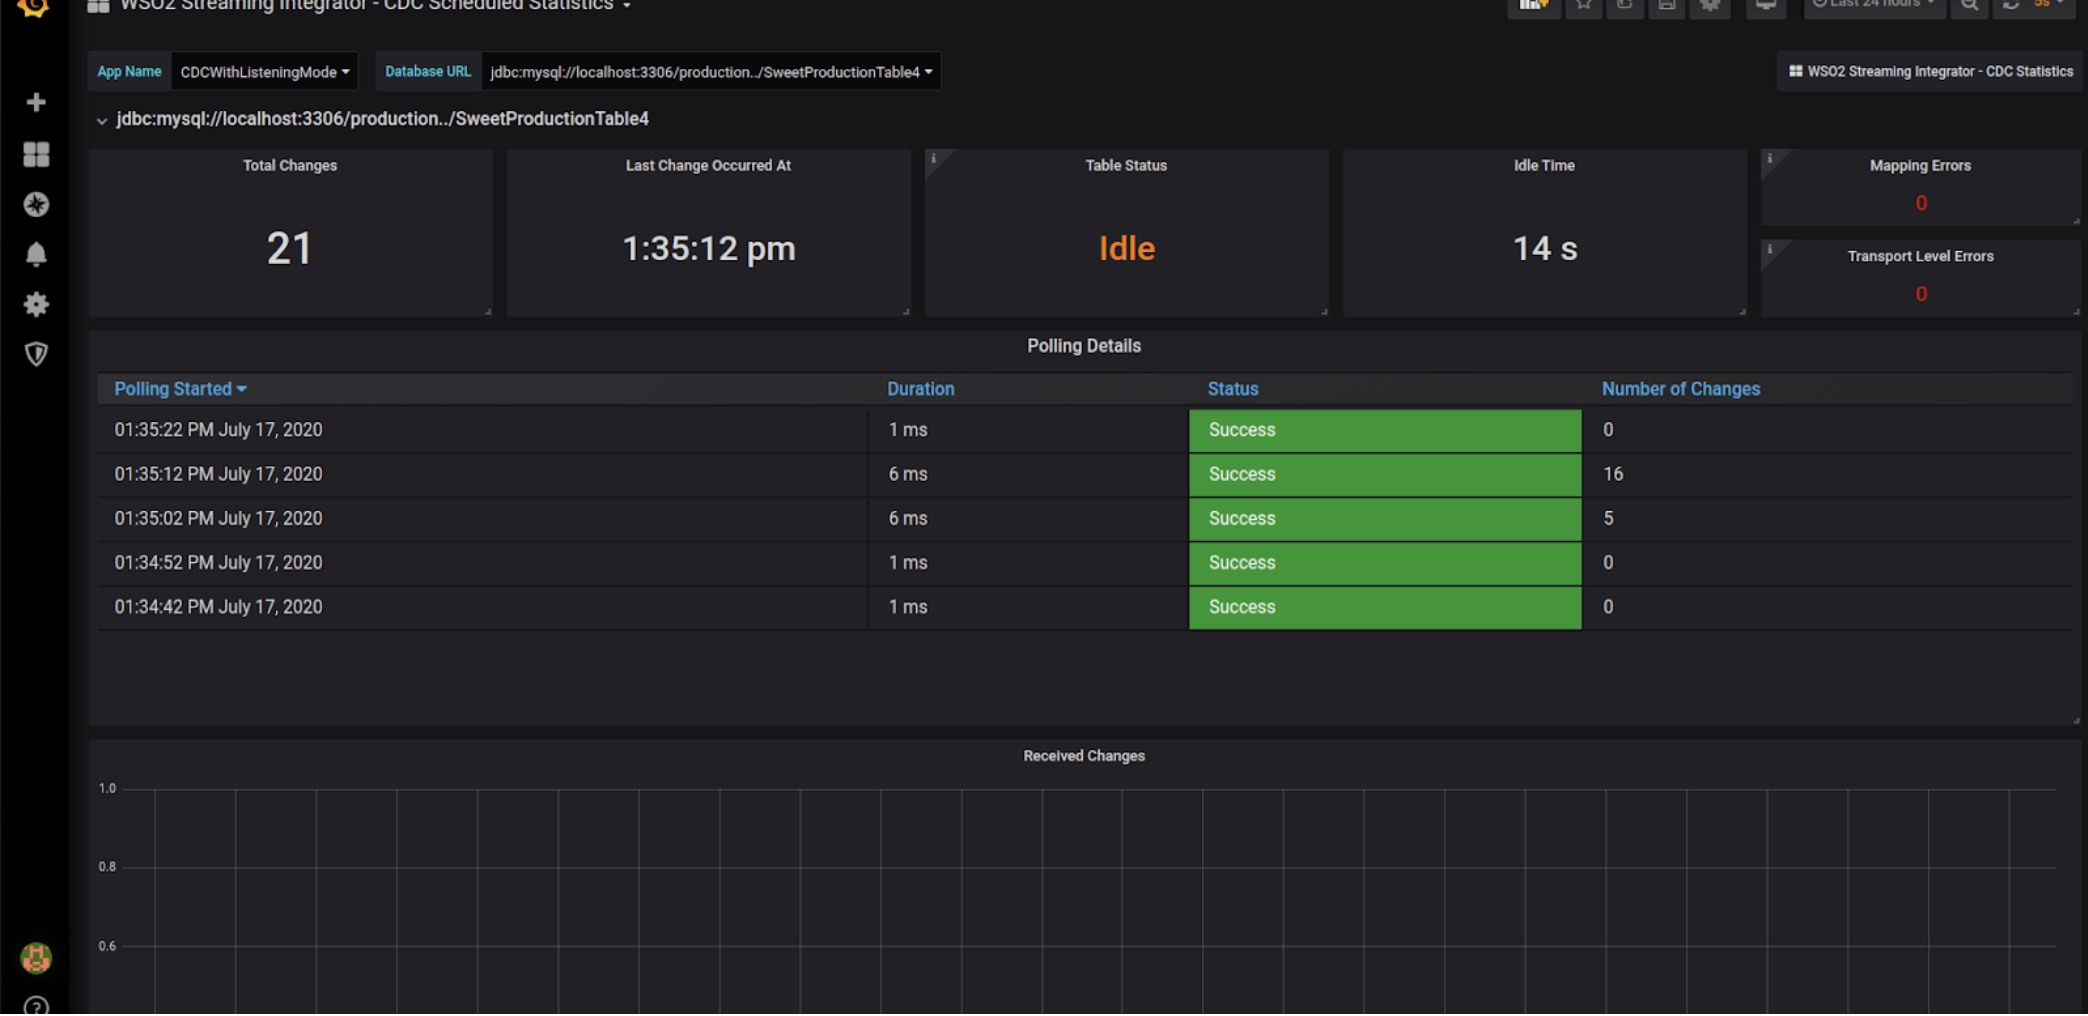
If you click on a table for which change data is captured in a scheduled manner by polling the table (i.e., a table in the CDC Scheduled Statistics section), the CDC Scheduled Statistics dashboard opens with change data related statistics specific to the selected table as shown in the example below.
Viewing File statistics**
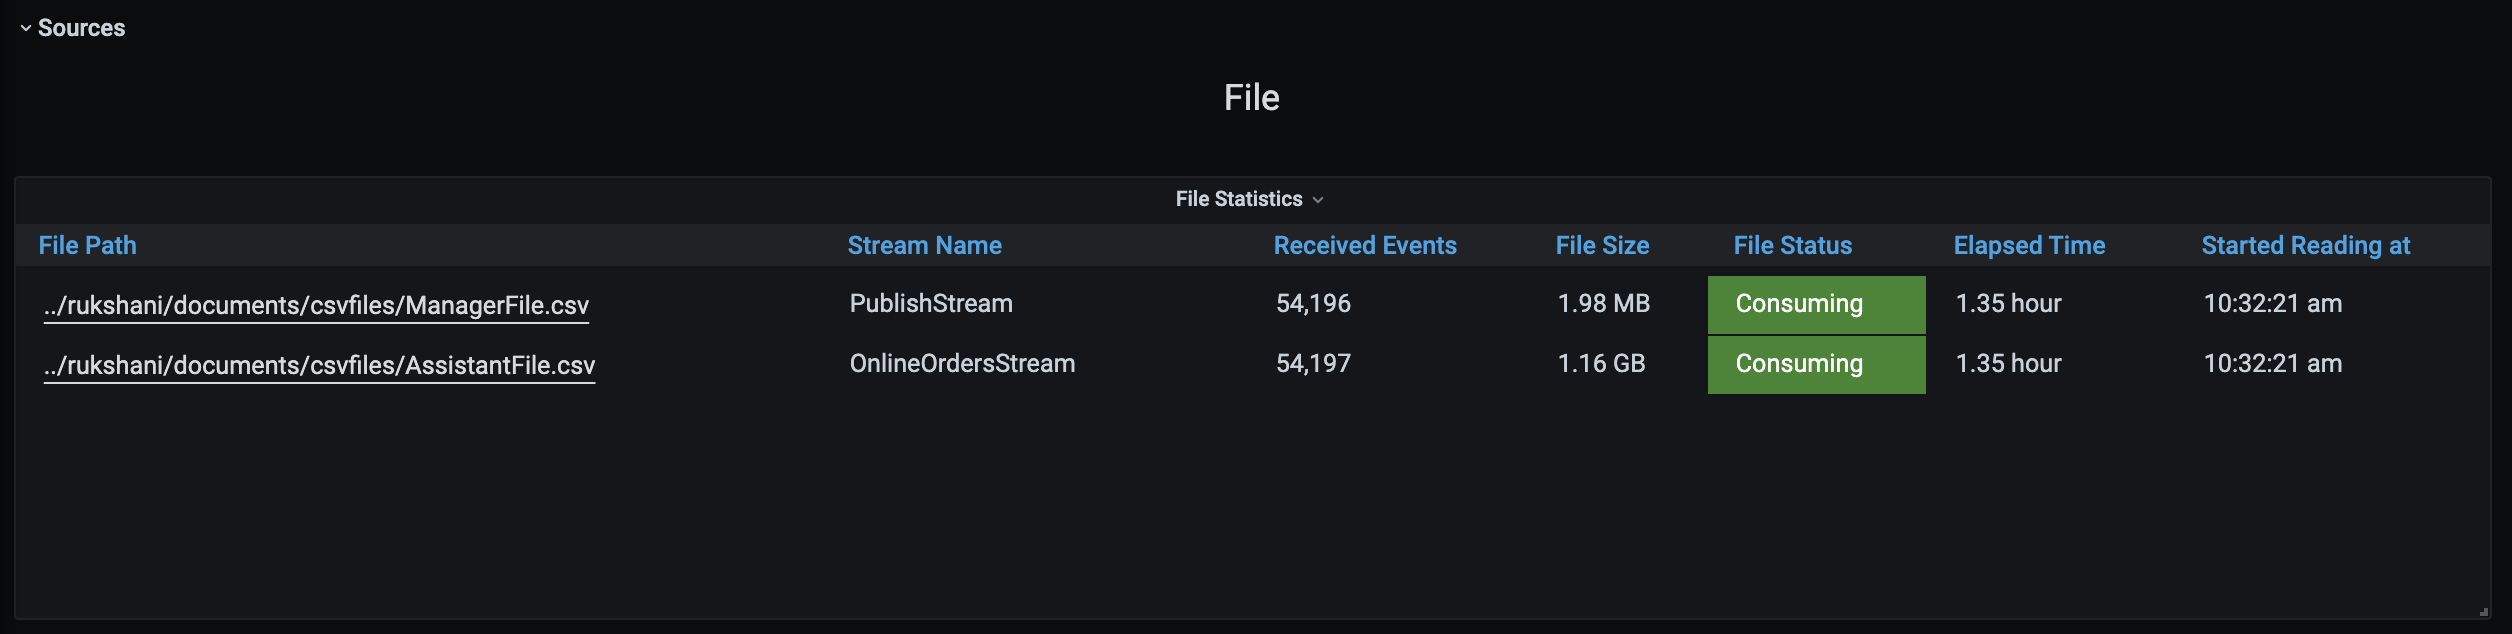
- When the content of a file is used as input data, the file is displayed in the Sources section as shown in the example below.
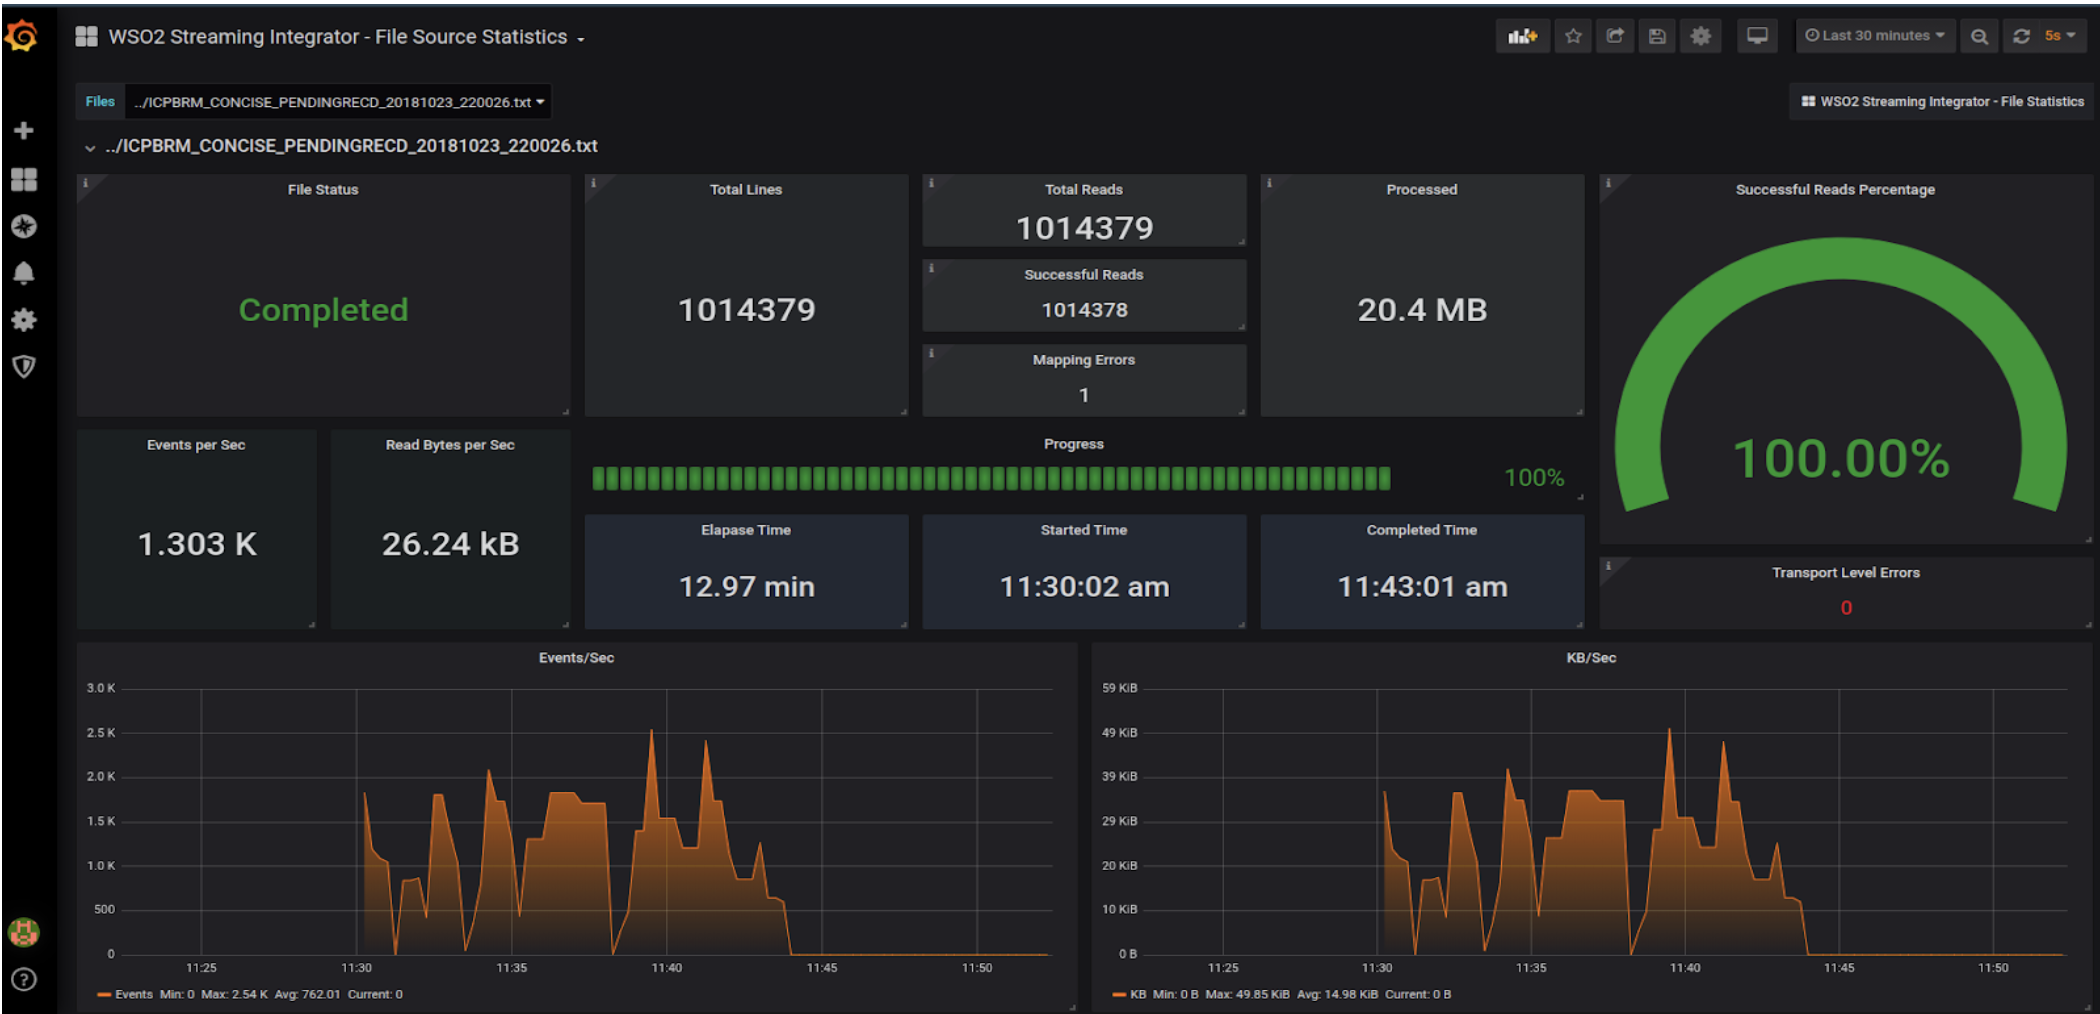
To view statistics for a specific file, click on it. As a result, the WSO2 Streaming Integrator - File Statistics dashboard opens as shown in the example below.
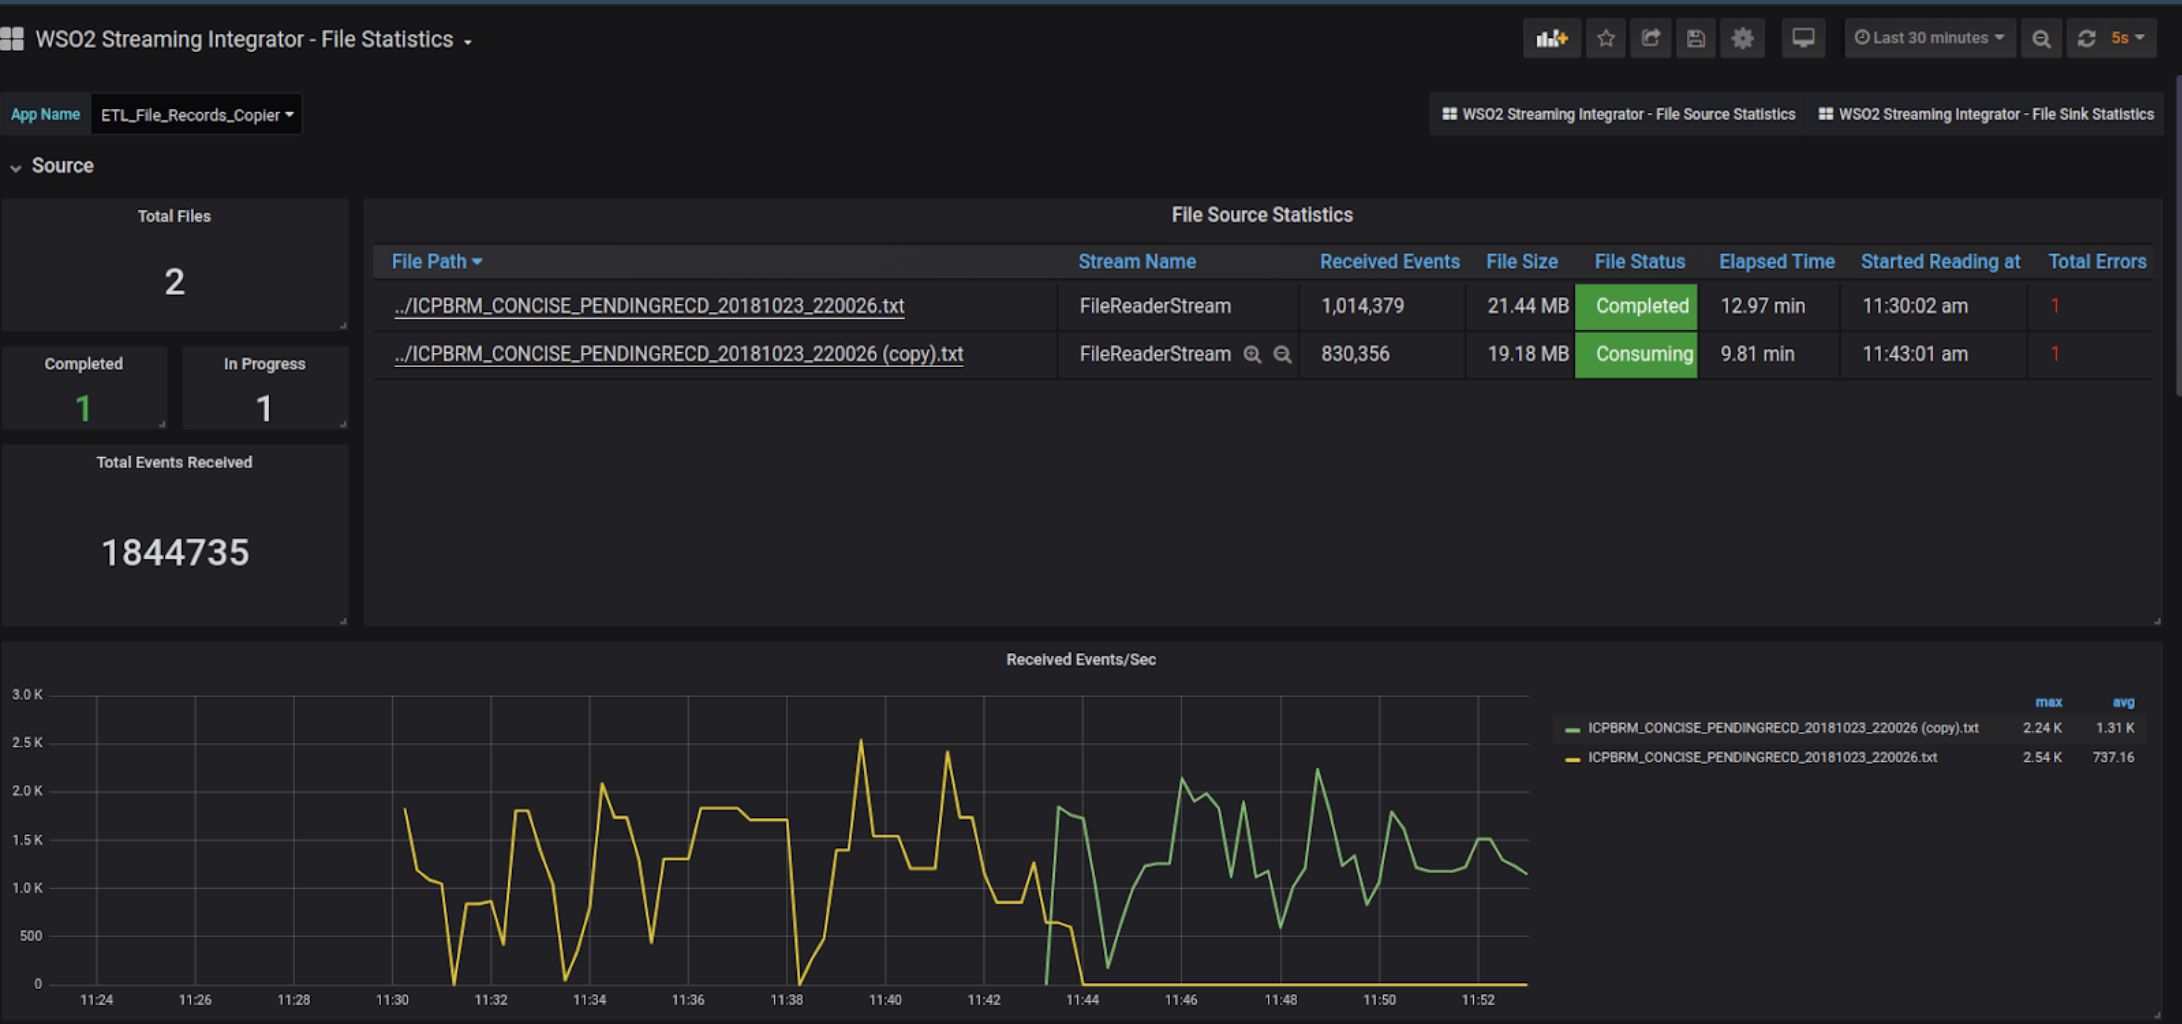
When you click on the same file again, the WSO2 Streaming Integrator - File Source Statistics dashboard opens with more detailed information about this source file as shown in the example below.
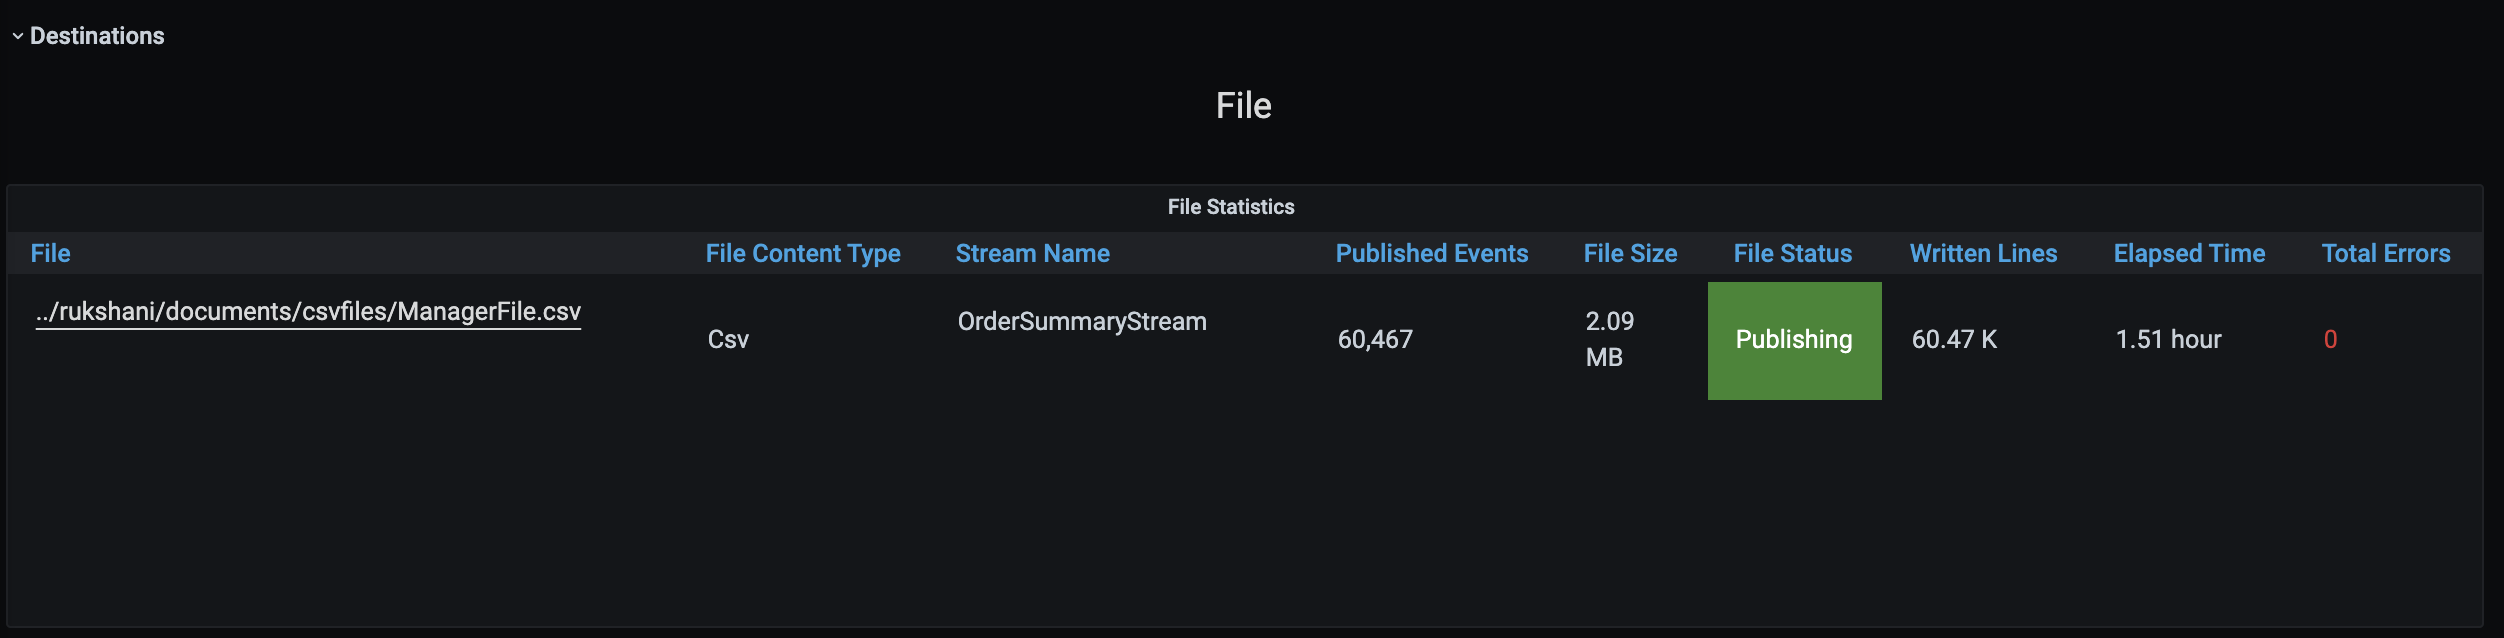
- When the content of a file is generated as an output of the Siddhi application, the file is displayed in the Destinations section as shown in the example below.
To view statistics for a specific file, click on it. As a result, the WSO2 Streaming Integrator - File Statistics dashboard opens as shown in the example below.
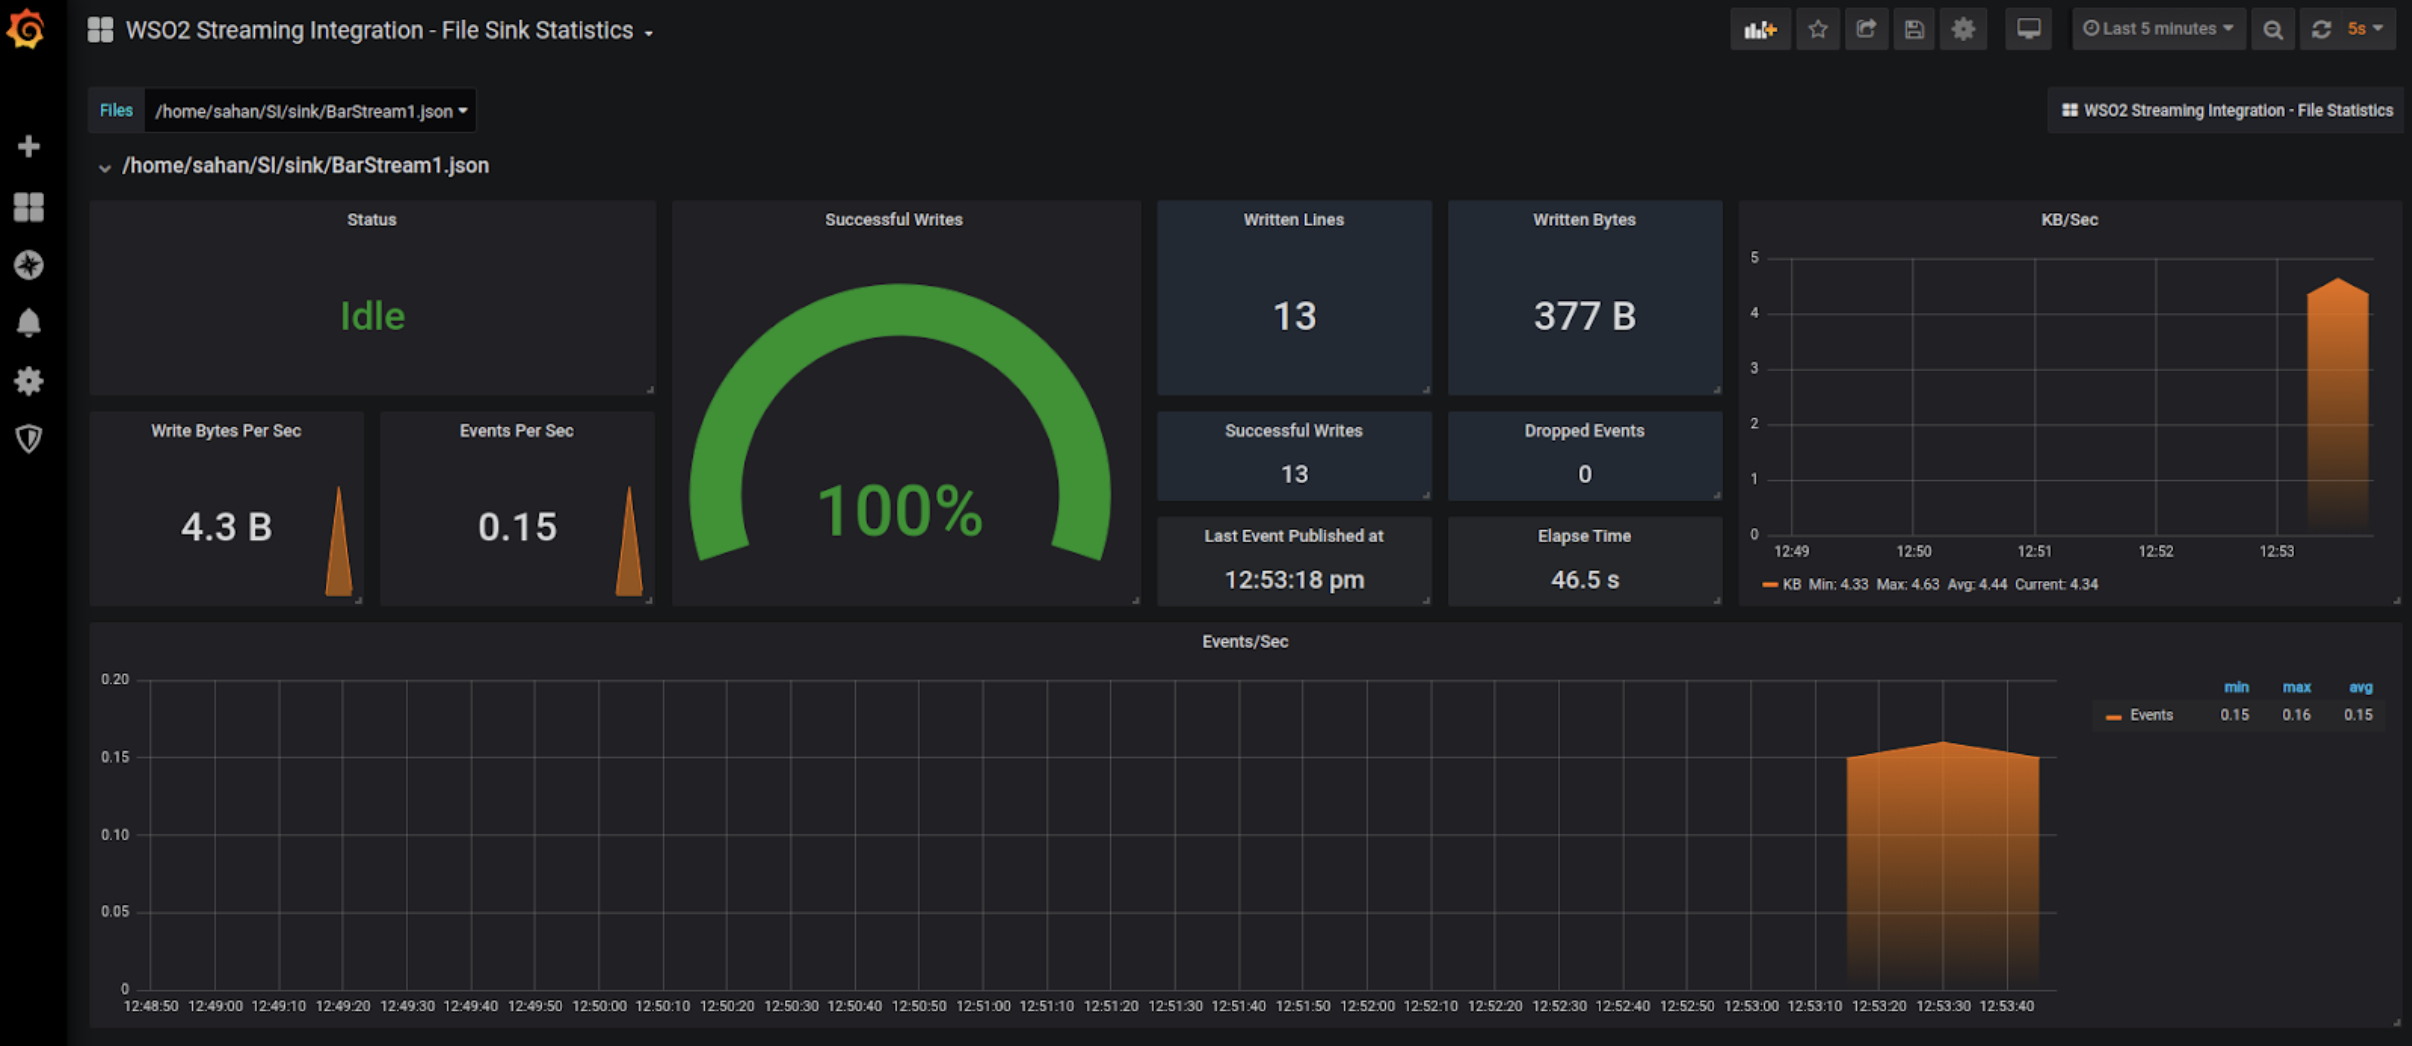
When you click on the same file again, the WSO2 Streaming Integrator - File Sink Statistics dashboard opens with more detailed information about this sink file as shown in the example below.
Viewing RDBMS statistics**
When the records of an RDBMS database is used as input data by the selected Siddhi application, the database is displayed in the Sources section. When any output generated by the selected Siddhi application is saved in a database, that database is displayed under Destinations.
In each section, all the databases of the relevant category is listed in a table as shown in the example below.
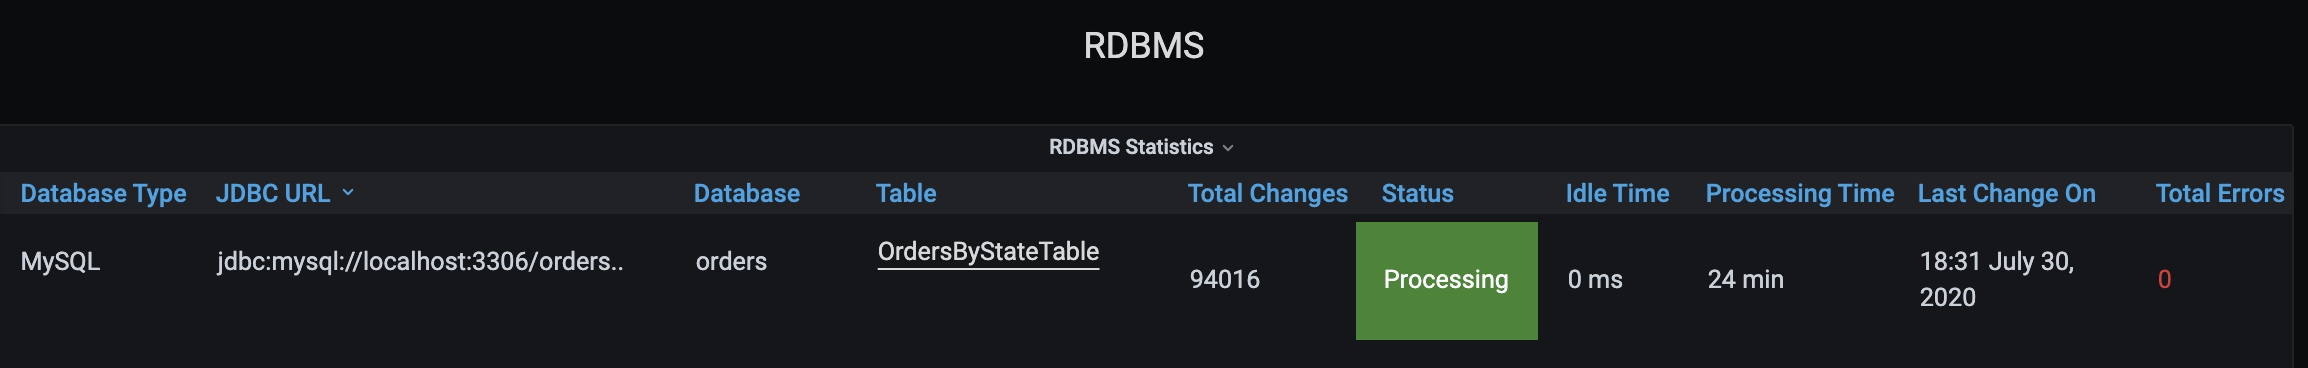
To view detailed statistics of a specific database, click on that database.
The RDBMS Statistics dashboard opens with RDBMS statistics specific to the selected database.
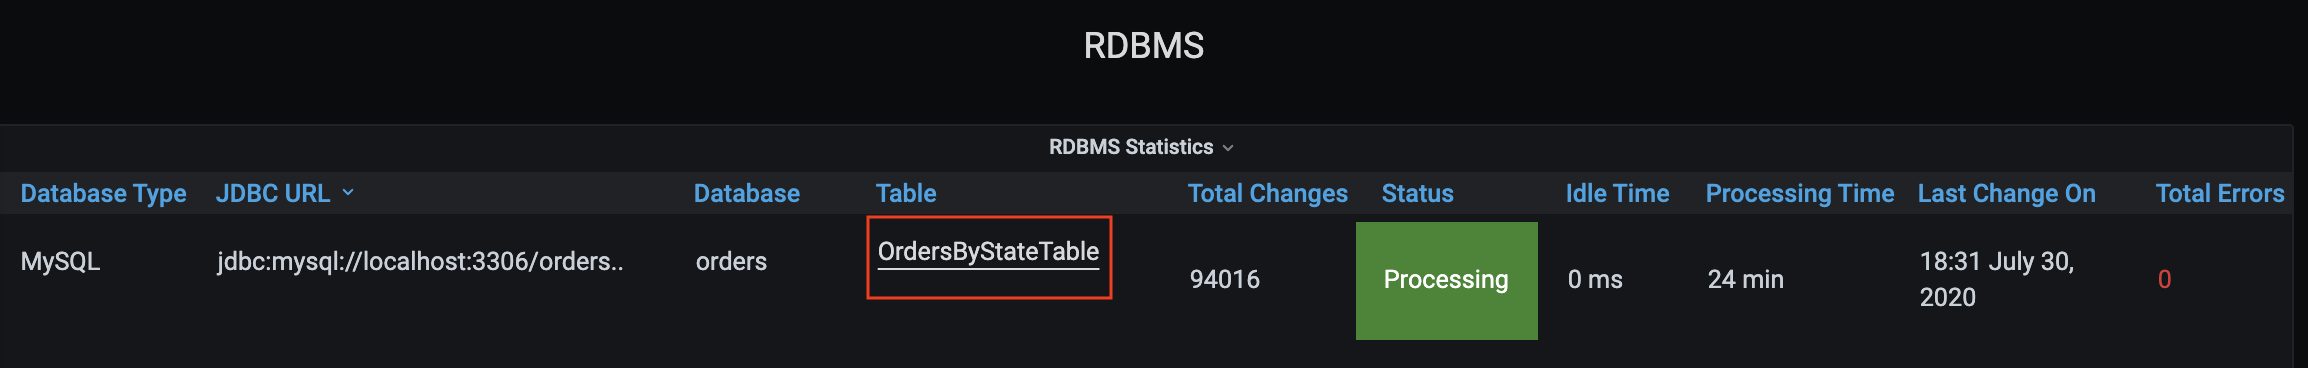
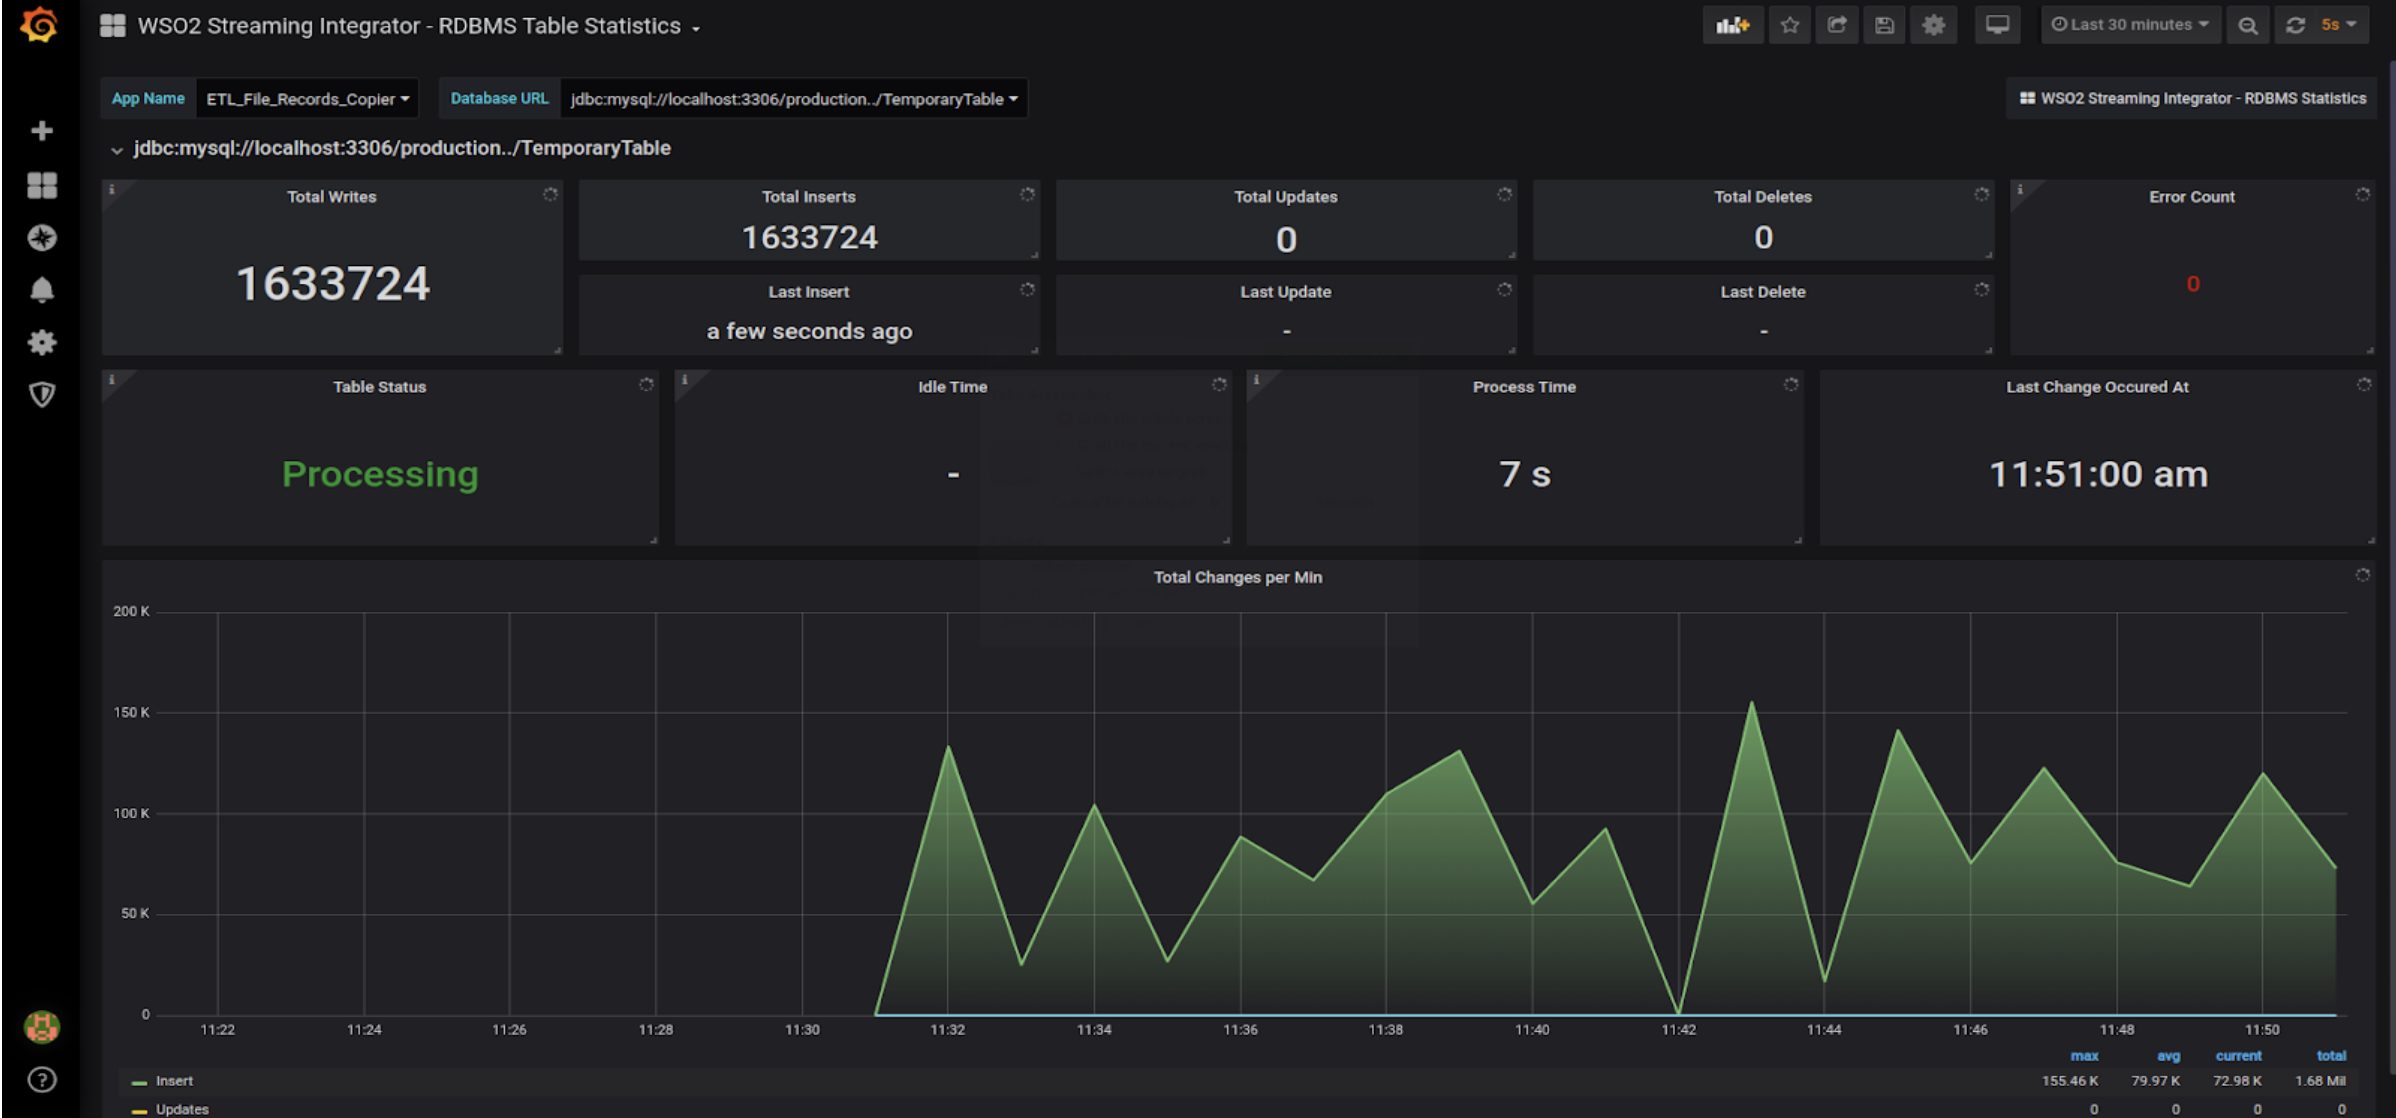
To view statistics relating to a specific table, click on the relevant table name in the RDBMS Table table.

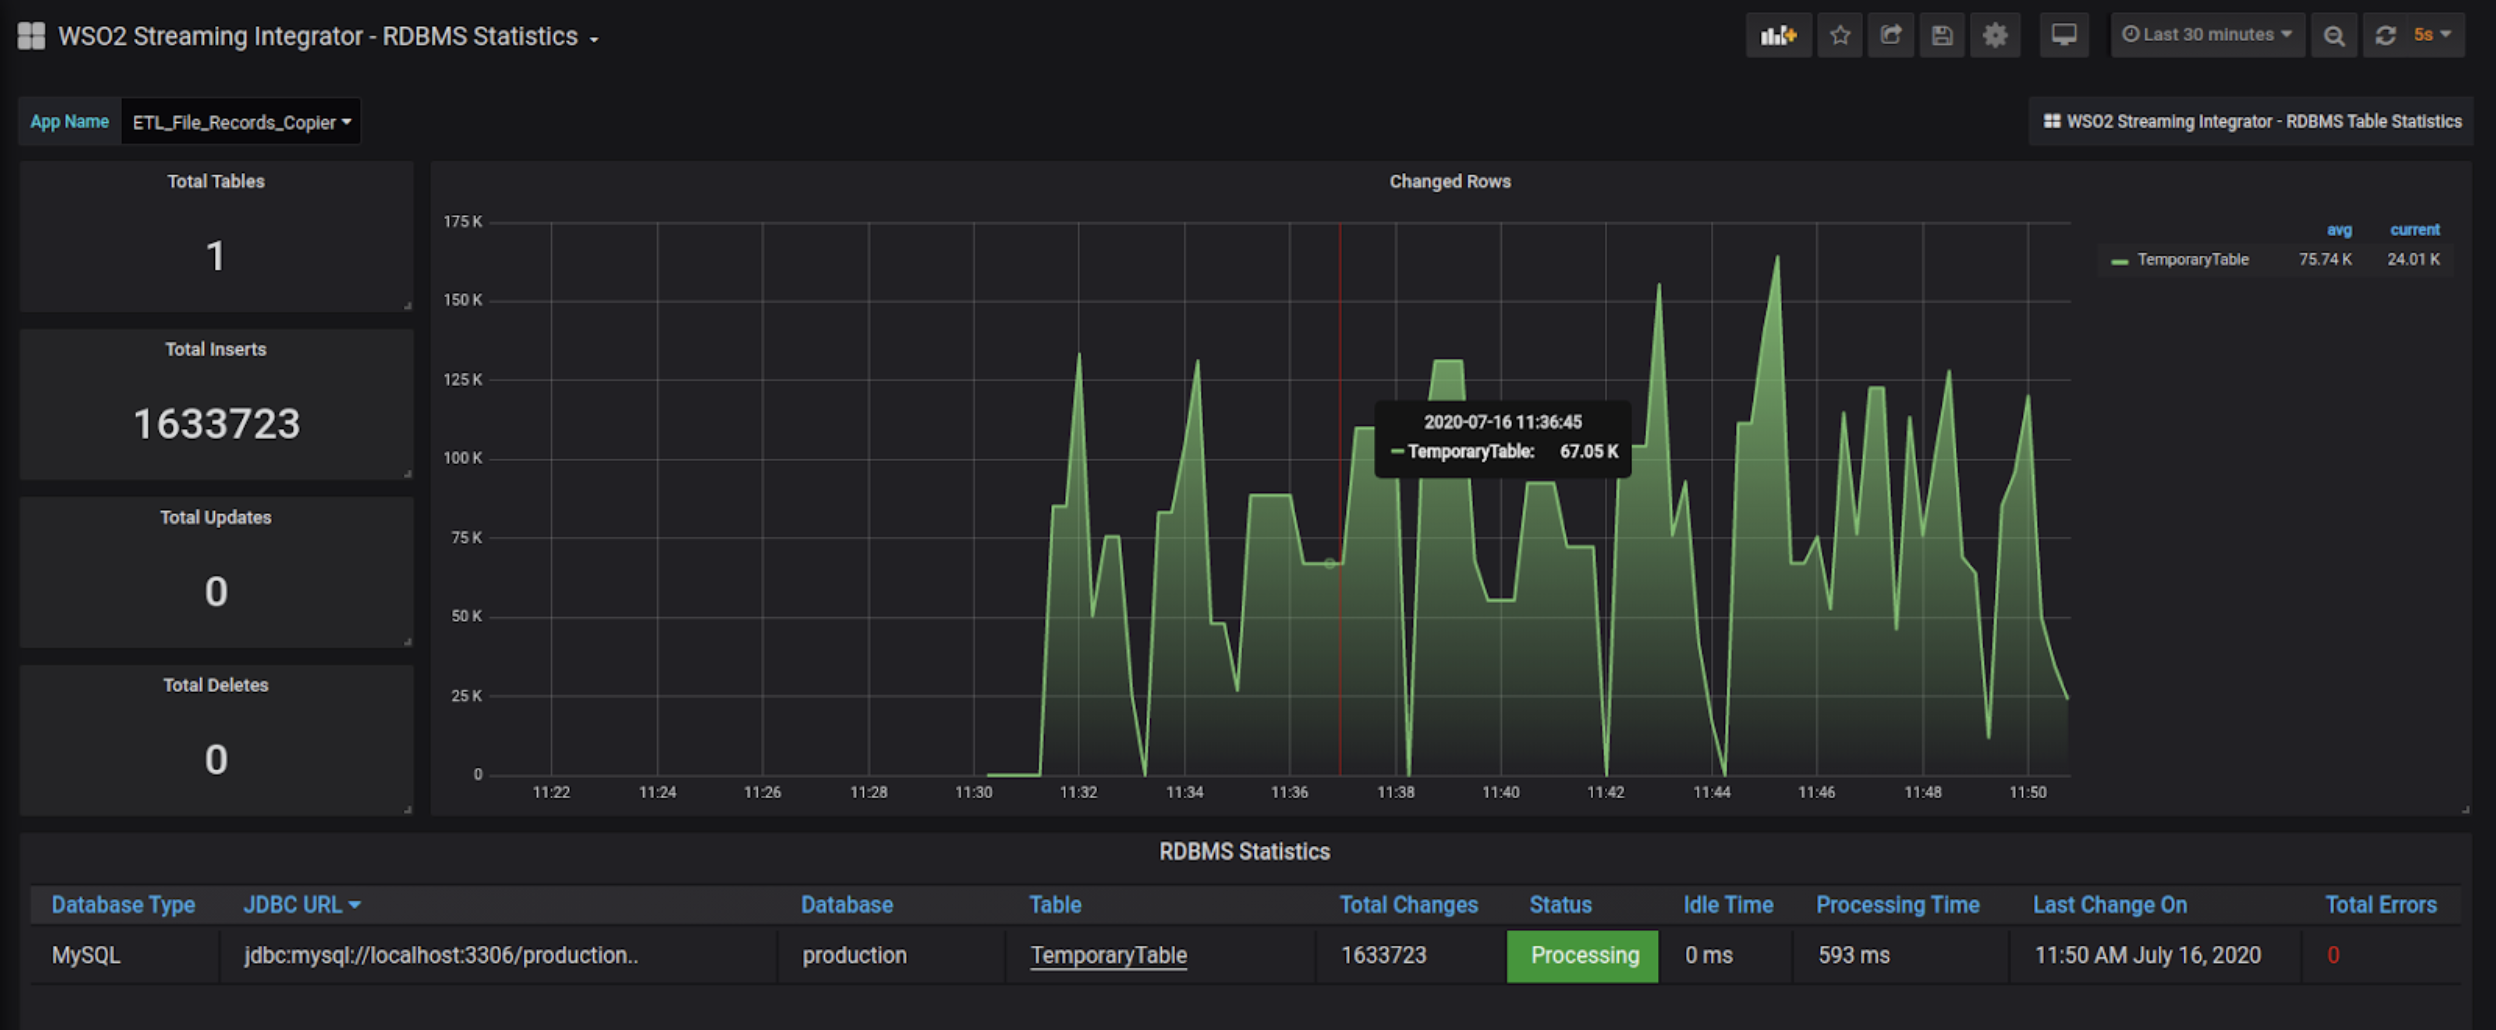
The RDBMS Table Statistics dashboard opens with statistics specific to the selected table.
Viewing Kafka statistics
Kafka related statistics are displayed in the Sources and Destinations sections of the WSO2 Streaming Integrator App Statistics dashboard.
To view the detailed overall Kafka Statistics for a specific app, click on any stream link on the table. As a result, you will be taken to WSO2 Streaming Integrator Kafka Statistics dashboard.
This page has two sections: Source and Sink.
-
The Source section shows the overall Kafka Source metrics such as total reads, input event rate etc. It also contains a table that lists all the streams that are associated to a Kafka source. If you click on a stream, it will take you to WSO2 Streaming Integrator Kafka Source Statistics dashboard.
This dashboard shows the Kafka Source statistics related to the selected stream. A stream is associated to one or more topics. Furthermore, each topic is associated to a partition. You can use this dashboard to view statistics for each separate Topic-Partition combination to which the selected stream is subscribed.
-
The Sink section shows the overall Kafka Sink metrics such as total writes, output event rate etc. It also contains a table that lists all the streams that are associated to a Kafka source. If you click on a stream, it will take you to WSO2 Streaming Integrator Kafka Sink Statistics dashboard.
This dashboard shows the Kafka Sink statistics related to the selected stream. Here, a stream publishes to a specific Kafka Topic and to one or more partitions. You can use this dashboard to view statistics for each separate Topic-Partition combination to which the selected stream publishes messages.